Concept understanding — Piecewise Function Definition
What is a Piecewise Function? — The Intuition
Imagine you're describing how much a taxi ride costs. The fare might be: ₹25 for the first kilometer, then ₹15 for every kilometer after that. That's not a single, simple rule — the rule changes depending on how far you've gone. That's exactly what a piecewise function captures: a function whose rule is made of different "pieces," each applying to a different part of the input.
In everyday life, piecewise rules are everywhere:
Income tax slabs (different rates for different income ranges)
Mobile data plans (different speeds after a limit)
Postage rates (different costs for different weights)
A piecewise function lets you write all these different rules in one clean mathematical statement.
The Precise Definition
A piecewise function is a function defined by multiple sub-functions, each applying to a specific interval (or "piece") of the domain.
Here's the standard notation:
f(x)=⎩⎨⎧f1(x),f2(x),⋮fn(x),x∈D1x∈D2⋮x∈Dn
Where:
f1,f2,…,fn are the sub-functions (each is a rule)
D1,D2,…,Dn are disjoint intervals that together cover the entire domain
Each input x belongs to exactly one of these intervals
Important
A piecewise function is still one function — not several functions glued together. For every x in the domain, there is exactly one output f(x).
A Concrete Example
Let's write the taxi fare example properly. Suppose the first kilometer costs ₹25, and every subsequent kilometer costs ₹15 per km. For a ride of x kilometers:
f(x)={25,25+15(x−1),0<x≤1x>1
Let's test it:
For x=0.5 km: f(0.5)=25 (first piece)
For x=1 km: f(1)=25 (first piece, includes the endpoint)
For x=3 km: f(3)=25+15(3−1)=25+30=55 (second piece)
Notice how the second piece uses x−1 — that's because the ₹15 rate only applies to the distance beyond the first kilometer.
Common Pitfalls (Watch Out!)
Watch out
Don't forget the domain conditions. A piecewise definition is incomplete without specifying which x values go with which rule. Writing just f(x)={x2,2x+1} is meaningless — you must say when each applies.
Watch out
Check the boundaries carefully. At the point where two pieces meet (like x=1 in the taxi example), the function must give only one output. If both pieces try to claim the same x, you have a problem — it's no longer a function.
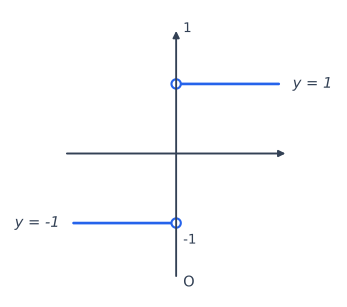
Figure — The stem asks to define and draw the signum function, and the canonical signum-function graph in the catalog i
The signum function reports only the sign of the input; its graph is two horizontal rays at y=±1 meeting at the origin.
Definition. The signum function f:R→R is defined as:
f(x)=⎩⎨⎧1,0,−1,x>0x=0x<0
Equivalently, f(x)=x∣x∣ for x=0, and f(0)=0.
Domain:R (all real numbers). Range:{−1,0,1}.
Graph description (no image available, described precisely instead):
For all x>0: the graph is the horizontal ray y=1, drawn as a solid line starting just to the right of the origin (an open circle at (0,1), since x=0 is excluded from this branch) and extending rightward forever. …