Q.Draw a graph of coefficient of volume expansion of copper as a function of temperature.
🔒You're viewing a preview — the full solution, concept, methods & PYQ mapping are locked.
🔒 Start your 14-day free trial to unlock the full solution →Concept understanding — Thermal Expansion
Thermal Expansion: Why Things Grow When Heated
You already know that matter is made of atoms or molecules. In a solid, these particles are locked into a lattice, but they are not still — they vibrate around fixed positions. When you heat a substance, you give its particles more energy. They vibrate faster and with larger amplitude. That larger vibration pushes the particles slightly farther apart from each other. The result? The whole object gets bigger. That is thermal expansion.
The key intuition: heat increases atomic vibration, which increases the average distance between atoms, which makes the object expand in every direction.
The Precise Physics
For small temperature changes, the expansion is directly proportional to the temperature change. This is an excellent approximation for most engineering and exam problems.
Linear expansion (change in one dimension — length):
ΔL=αL0ΔT
where α is the coefficient of linear expansion, L0 is the original length, and ΔT is the temperature change.
Area expansion (change in two dimensions):
ΔA=βA0ΔT
where β is the coefficient of area expansion.
Volume expansion (change in three dimensions):
ΔV=γV0ΔT
where γ is the coefficient of volume expansion.
α:β:γ=1:2:3
This ratio is not a coincidence — it follows directly from geometry. Imagine a cube of side L. Its area is L2 and its volume is L3. If each side expands by a factor (1+αΔT), then:
- New area = L2(1+αΔT)2≈L2(1+2αΔT) → so β=2α
- New volume = L3(1+αΔT)3≈L3(1+3αΔT) → so γ=3α
The approximations hold because αΔT is tiny (typically 10−5 per °C), so squares and cubes of it are negligible.
This ratio only holds for isotropic materials — solids that expand equally in all directions. For anisotropic crystals (like wood along vs. across the grain), the coefficients differ in different directions. In Indian exams, assume isotropy unless told otherwise.
Why Liquids Are Different
Liquids have no fixed shape, so they have no "linear" or "area" expansion — only volume expansion matters. A liquid expands to fill its container. The coefficient of volume expansion for a liquid is typically much larger than for a solid (about 10 times larger for water compared to steel).
A classic exam point: when a liquid is heated in a container, both the liquid and the container expand. The apparent expansion you see (liquid rising in a graduated cylinder) is the difference between the liquid's true expansion and the container's expansion.
For exam problems: if a liquid overflows on heating, the volume spilled = γliquidV0ΔT−γcontainerV0ΔT. The container's expansion "makes room" for some of the liquid's expansion.
Real-World Examples You Already Know …
This question asks the student to sketch a graph, which cannot be reproduced as an actual image here; instead, the key shape and behaviour of the curve are described in detail below so the graph can be drawn correctly. …
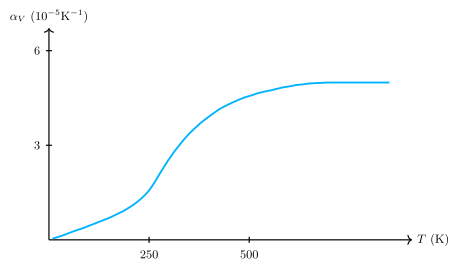
The coefficient of volume expansion of copper is strongly temperature-dependent at very low temperatures but becomes nearly constant at higher temperatures — this description gives the exact shape to draw since an image cannot be embedded in this text answer.
A text-based worked answer cannot display an actual plotted image; instead, here is a precise description of the curve to sketch, following the standard experimental behaviour reported for a metal like copper:
- Axes: Plot the coefficient of volume expansion αv (in K⁻¹, y-axis) against absolute temperature T (in K, x-axis).
- Near T → 0 K: αv starts at essentially zero (or a very small value) — near absolute zero, thermal expansion effects vanish.
- Low-to-moderate T (roughly up to a few hundred K): αv rises rapidly and nonlinearly with increasing temperature. …
Showing the 12 most recent of 14 on this concept.
- CBSE 2026Set ANNUAL1 markMCQQ.When water is heated from 0 degrees C to 4 degrees C, the volume of water(a) remains the same(b) decreases(c) increases(d) none of these
›Reveal solutionSolution
Water shows anomalous expansion: unlike most substances, its volume DECREASES (not increases) as it is warmed from 0 degrees C to 4 degrees C, because its density is maximum at 4 degrees C.
Most substances expand uniformly on heating. Water is an exception in the narrow range 0 to 4 degrees C: as ice-cold water (just above 0 degrees C) is warmed, its molecules rearrange in a way (related to the breakdown of the open hydrogen-bonded ice-like structure) that causes the volume to CONTRACT, reaching a minimum volume -- and therefore MAXIMUM density -- exactly at 4 degrees C. Only above 4 degrees C does …
- CBSE 2026Set ANNUAL1 markMCQQ.When a uniform rod is heated, which of the following quantities of the rod will increase?(a) Mass(b) Moment of inertia(c) Weight(d) Centre of mass
›Reveal solutionSolution
Heating a rod increases its length by thermal expansion; since I = integral of r^2 dm depends on how far the mass lies from the axis, a longer rod has a larger moment of inertia, even though its mass is unchanged.
When a uniform rod is heated, it undergoes linear thermal expansion: its length increases according to L = L0(1 + alpha*deltaT), where alpha is the coefficient of linear expansion and deltaT is the rise in temperature.
Let us check each option:
- Mass: No material is added to or removed from the rod on heating, so its mass stays exactly the same.
- Weight: Weight = mass times g. Since mass is unchanged and g (at a given location) is unchanged, weight stays the same.
- Centre of mass: For a uniform rod, the centre of mass lies at its geometric centre. Since the rod expands symmetrically about its centre, the centre of mass (relative to the rod itself) does not shift. …
- CBSE 2026Set ANNUAL1 markQ.Write true or false: The density of water is maximum at 0 degrees C temperature.
›Reveal solutionSolution
The statement is FALSE: water's density is maximum at 4°C (the anomalous expansion of water), not at 0°C.
Most substances contract steadily as they are cooled, so their density steadily increases all the way down to their freezing point. Water is a notable exception, called the anomalous expansion of water: as water is cooled from higher temperatures toward 0°C, its density increases only until it reaches 4°C; below 4°C, further cooling causes water to expand slightly again, so its density decreases as it approaches 0°C (and ice, at 0°C, is even less dense, which is why ice floats …
- CBSE 2026Set ANNUAL1 markMCQQ.When water freezes, the distance between its molecules(a) Decreases(b) Increases(c) Becomes zero(d) Remains unchanged
›Reveal solutionSolution
On freezing, water expands into an open structure, so molecular distance increases. Answer (B).
Water shows anomalous behaviour: when it freezes into ice, the molecules arrange into an open, cage-like hexagonal crystal held together by hydrogen bonds. This structure occupies MORE volume than the same mass of liquid water.
…
- CBSE 2026Set ANNUAL1 markMCQQ.A metal sheet with a circular hole is heated. The hole(a) gets smaller(b) gets larger(c) remains unchanged(d) gets deformed
›Reveal solutionSolution
A hole in a heated plate expands like the surrounding material, so it gets larger. Answer (B).
When a metal sheet is heated, every linear dimension increases by the same factor (1 + alpha_l dT). Imagine the disc of metal that would fill the hole; it too would expand. So the h …
- CBSE 2025Set ANNUAL1 markMCQQ.When water is heated from 0°C to 10°C, its volume (A) decreases (B) increases (C) first decreases then increases (D) none of these
›Reveal solutionSolution
As water is heated from 0°C to 10°C, its volume first decreases (till 4°C) and then increases.
Most substances expand continuously on heating, but water shows an anomalous behaviour between 0°C and 4°C: as it is heated from 0°C, its volume actually decreases until 4°C (where density is maximum), because of the breaking down of the ice-like hydrogen-bonded structure present in cold water. Above 4°C, water behaves normally and its …
- CBSE 2025Set ANNUAL1 markMCQQ.The top of lake is frozen at the atmospheric temperature -10°C. The temperature at the bottom of the lake at that time is most likely to be (A) 0°C (B) -4°C (C) 4°C (D) -10°C
›Reveal solutionSolution
Even though the surface is frozen at -10°C, the water at the bottom of the lake stays at about 4°C.
Water is densest at 4°C (anomalous expansion). As a lake cools in winter, surface water cools, becomes denser, and sinks — until the whole lake reaches 4°C. Further surface cooling below 4°C makes that top layer less dense (due to anomalous expansion), so it stays on top and eventually freezes into ice at 0°C, while the layer beneath the ice stays close to 4°C — th …
- CBSE 2025Set ANNUAL1 markQ.Write relation between coefficient of linear expansion (α), coefficient of area expansion (β) and coefficient of volume expansion (γ).
›Reveal solutionSolution
Because area scales with the square of length and volume with the cube, the area-expansion coefficient is twice, and the volume-expansion coefficient is three times, the linear-expansion coefficient of the same material.
Let a solid have linear dimension L, area A∝L2, and volume V∝L3.
…
- CBSE 2024Set ANNUAL1 markMCQQ.There is a concentric spherical cavity in a solid ball of metal. If the ball is heated, then volume of cavity (A) will decrease (B) will increase (C) will remain unchanged (D) none of these
›Reveal solutionSolution
The cavity inside a heated solid expands, just like a solid piece of the same size would.
A useful way to think about a cavity in a solid is to imagine it filled with the same material. When the whole solid (including that imagined filling) is heated, it expands uniformly according to its coefficient of volume expansion. Removing the imagined filling doesn't change how the surrounding solid ex …
- CBSE 2024Set SET-AP55001 markQ.Write the relation between the coefficient of linear expansion (alpha), the coefficient of areal (superficial) expansion (beta), and the coefficient of volume (cubical) expansion (gamma).
›Reveal solutionSolution
For an isotropic solid, the areal and cubical expansion coefficients are simple multiples of the linear expansion coefficient: β = 2α and γ = 3α.
Consider a cube of side L that expands uniformly on heating by ΔT. Each side changes as ΔL = αLΔT, so the linear expansion coefficient is α = ΔL/(LΔT).
For area, A = L^2, so dA = 2L dL, giving ΔA/A = 2(ΔL/L) = 2αΔT — so the areal expansion coefficient β = ΔA/(AΔT) = 2α.
…
- CBSE 2024Set SET-NDP60001 markMCQQ.At which temperature is the density of water maximum:(a) 4°C(b) 0°C(c) -25°C(d) -27°C
›Reveal solutionSolution
Because of anomalous expansion, water's density is maximum at 4°C, not at 0°C.
Most substances contract steadily as they cool and expand steadily as they heat. Water is unusual: as it is cooled from higher temperatures down to 4°C, it contracts (density rises) like a normal liquid, but on cooling further from 4°C to 0°C, it actually expands again (density falls) — this is called the anomalous expansion of water. As a result, water's density is at its highest at 4°C, and is lower both above and below this temperature (including as ice at 0°C, which is why ic …
- CBSE 2024Set ANNUAL1 markQ.State whether true or false: At 4 degrees Celsius, the volume of water is minimum.
›Reveal solutionSolution
True. Water shows anomalous expansion: its density is maximum (so volume is minimum, for a fixed mass) at 4 degrees C.
Most substances contract steadily on cooling. Water is anomalous: as it is cooled from higher temperatures down to 4 degrees C, its volume decreases (density rises) like a normal liquid. But on cooling further from 4 degrees C to 0 degrees C, water actually starts to expand again (density falls) as hydrogen-bonded ice-like structures begin forming. …
🎓Unlock everything free for 14 days
- ✓Full step-by-step solutions
- ✓Concept-first explanations
- ✓Methods, shortcuts & mistakes
- ✓PYQ mapping + timed mock tests
Full access for 14 days. No credit card required.