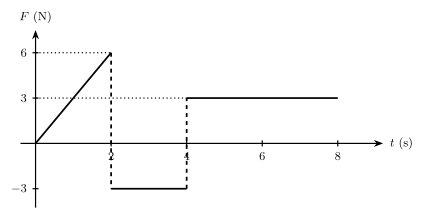
Q.The force F acting on a particle of mass m is indicated by the force-time graph shown below. The change in Momentum of the particle over the time interval from zero to 8 second is:
🔒You're viewing a preview — the full solution, concept, methods & PYQ mapping are locked.
🔒 Start your 14-day free trial to unlock the full solution →Concept understanding — Impulse Momentum Theorem
The Intuition: Why Do We Need a "New" Idea?
Imagine you're catching a cricket ball. If you let your hands stay rigid, the ball stings and might bounce off. But if you give with the ball — pulling your hands back as you catch — the catch feels soft and the ball stops gently.
Same ball, same speed, same change in momentum. But the force you feel is completely different. Why?
The answer is time. When you pull your hands back, you increase the time over which the ball slows down. A longer time means a smaller force — even though the total "oomph" needed to stop the ball is the same. That "oomph" is called impulse.
Impulse is not a mysterious new quantity. It's just force multiplied by the time it acts. If you push gently for a long time, or push hard for a short time, you can produce the same effect.
The Precise Statement
The Impulse-Momentum Theorem says:
The impulse delivered to an object equals the change in its momentum.
In symbols:
J=Δp
Where:
- J is the impulse (a vector)
- Δp is the change in momentum (also a vector)
And since impulse is force times time:
FavgΔt=mvf−mvi
J=FavgΔt=Δp
Breaking It Down Piece by Piece
Momentum (p) is mass times velocity: p=mv. It's a measure of how hard it is to stop a moving object. A truck moving slowly has large momentum; a bullet moving fast has large momentum too.
Impulse (J) is the product of the average force and the time interval over which it acts: J=FavgΔt.
The theorem connects them: the net impulse changes the momentum. If you apply a net force to an object for some time, its momentum changes by exactly that amount.
A common mistake is to think impulse is just force. It's force × time. A huge force acting for a tiny time (like a bat hitting a ball) can produce the same impulse as a tiny force acting for a long time (like a gentle push).
Why This Matters: Real-World Examples
Catching a ball (soft vs. hard hands)
- Hard hands: Δt is small → Favg is large (it hurts)
- Soft hands: Δt is large → Favg is small (it's comfortable)
- In both cases, Δp is the same (ball goes from moving to stopped)
Airbags in cars
- Without airbag: your head hits the dashboard in ~0.01 s → huge force
- With airbag: your head decelerates over ~0.1 s → force is 10 times smaller
- Same change in momentum, but the airbag extends the time
A cricket bat hitting a ball
- The bat is in contact with the ball for a few milliseconds
- The force during that contact is enormous (hundreds of Newtons)
- The impulse changes the ball's momentum from one direction to another
The Mathematical Derivation (Short)
Start from Newton's second law:
Fnet=ma=mdtdv
Multiply both sides by dt:
Fnetdt=mdv
Integrate over the time interval:
∫titfFnetdt=m∫vivfdv=mvf−mvi
The left side is the impulse (the area under the force-time graph). The right side is the change in momentum. …
Change in momentum equals the impulse, which is the (signed) area under the F–t graph. Adding the areas of the three segments (triangle, then two rectangles) from t=0 to t=8s gives the …
Impulse = change in momentum = area under the F–t graph (areas below the axis count as negative). Summing the three regions of this graph gives 12 Ns.
By the impulse–momentum theorem: Δp=∫Fdt= (net signed area under the F–t curve).
Break the graph into its three described regions:
Region 1 (0 to 2 s): F rises linearly from 0 to 6 N — a triangle.
Area1=(1/2)(2)(6)=6 Ns
Region 2 (2 to 4 s): F is constant at −3 N — a rectangle below the axis.
Area2=(−3)(2)=−6 Ns
…
Showing the 12 most recent of 24 on this concept.
- CBSE 2026Set ANNUAL1 markMCQQ.What is that physical quantity called which is equal to the change in momentum of a body?(a) Force(b) Acceleration(c) Impulse(d) Reaction
›Reveal solutionSolution
By definition, impulse J = change in momentum = delta p = F x delta t.
Starting from Newton's second law in its more general (momentum) form:
F = dp/dt
Integrating both sides over the time interval the force acts:
J = Integral(F dt) = delta p = p_final - p_initial
…
- CBSE 2026Set ANNUAL1 markMCQQ.Dimensional formula of impulse is similar to the dimensional formula of -(a) Force(b) Angular momentum(c) Pressure(d) Linear momentum
›Reveal solutionSolution
Impulse J = FΔt has the same dimensional formula as linear momentum, MLT⁻¹, because the impulse-momentum theorem states J = Δp.
Impulse is defined as J = F × Δt, dimensions [MLT⁻²][T] = MLT⁻¹. Linear momentum is p = mv, dimensions [M][LT⁻¹] = MLT⁻¹ — identical. This is not a coincidence: Newton's second law states F = dp/dt, so integrating over time, F·Δt = Δp, i.e., impulse always equals the change in linear momentum (the impulse-mo …
- CBSE 2026Set sz1 markMCQQ.An impulse is the change in:(a) velocity(b) kinetic energy(c) momentum(d) displacement
›Reveal solutionSolution
Impulse J = F(avg) x delta t = change in momentum (delta p) of the body.
From Newton's second law, F = dp/dt, so integrating force over the short time of contact: J = integral F dt = delta p = mv(final) - mv(initial). Impulse and change in momentum h …
- CBSE 2026Set ANNUAL1 markMCQQ.Match the column - select the correct definition (from Column B) for the term 'Impulse' (Column A):(a) change in linear momentum(b) motion opposing force(c) loss of energy(d) rate of change of momentum(e) ability of doing work(f) rate of doing work
›Reveal solutionSolution
Impulse equals the change produced in linear momentum.
Impulse J is defined as J = F × Δt for a constant force acting over a short time Δt (or ∫F dt for a varying force). Since F = dp/dt, integrating over the interval of action gives:
J = ∫ F dt = ∫ dp = Δp = p_final − p_initial …
- CBSE 2026Set ANN1 markMCQQ.A graph is drawn with time along x axis and force along y axis. The area under the graph represents(a) torque(b) impulse(c) momentum(d) couple
›Reveal solutionSolution
The area under a force-time graph is impulse, which also equals the change in momentum.
Impulse is defined as the product of force and the time for which it acts: J = integral of F dt. On a graph with time on the x-axis and force on the y-axis, this integral is precisely the area enclosed between the curve and the time axis.
By the impulse-momentum theorem, this impulse also equals the change in the body's linear momentum: …
- CBSE 2025Set ANNUAL1 markMCQQ.The force F acting on a particle of mass m is indicated by the force-time graph shown below. The change in Momentum of the particle over the time interval from zero to 8 second is:(a) 24 Ns(b) 20 Ns(c) 12 Ns(d) 6 Ns
›Reveal solutionSolution
Impulse = change in momentum = area under the F–t graph (areas below the axis count as negative). Summing the three regions of this graph gives 12 Ns.
By the impulse–momentum theorem: Δp=∫Fdt= (net signed area under the F–t curve).
Break the graph into its three described regions:
Region 1 (0 to 2 s): F rises linearly from 0 to 6 N — a triangle.
Area1=(1/2)(2)(6)=6 Ns
Region 2 (2 to 4 s): F is constant at −3 N — a rectangle below the axis.
Area2=(−3)(2)=−6 Ns
…
- CBSE 2025Set ANNUAL1 markMCQQ.The momentum of a bus having mass 'm' standing at the bus stop is-(a) Infinite(b) Equal to its mass(c) Zero(d) None of the above
›Reveal solutionSolution
The momentum of the standing bus is zero.
Linear momentum of a body is defined as the product of its mass and velocity:
p=mv
…
- CBSE 2025Set ANNUAL1 markQ.Name the physical quantity whose unit is Newton second.
›Reveal solutionSolution
The quantity whose SI unit is the newton-second (N s) is impulse, defined as the product of force and the time for which it acts.
Impulse J=FΔt (or ∫Fdt for a varying force). Its unit is N⋅s=(kg m s−2)⋅s=kg m s−1, the same as the unit of linear momentum — consistent with the impul …
- CBSE 2024Set ANNUAL1 markMCQQ.A body of mass m and speed v collides with a wall perpendicularly and returns with the same speed v. The momentum imparted to the wall is (A) mv (B) ½mv (C) 2mv (D) zero
›Reveal solutionSolution
The wall receives momentum 2mv from the elastically bouncing body.
Before collision the body's momentum (taking the incoming direction as positive) is +mv. After bouncing back with the same speed, its momentum is −mv. The change in the body's momentum is Δp=(−mv)−(mv)=−2mv, i.e. magnitude 2mv.
…
- CBSE 2024Set ANNUAL1 markMCQQ.A ball of mass m strikes a rigid wall with velocity u and rebounds with the same speed. The impulse imparted to the ball by the wall is(a) 2mu(b) mu(c) zero(d) -2mu
›Reveal solutionSolution
Impulse = change in momentum. Since the ball's velocity reverses direction (same speed, opposite sign) after rebounding, the magnitude of the impulse works out to 2mu.
Take the direction of the ball's motion toward the wall as positive.
- Initial momentum, p_i = +mu
- After rebounding with the same speed, the ball moves away from the wall: final momentum, p_f = -mu
Impulse imparted to the ball = change in momentum = p_f - p_i = (-mu) - (mu) = -2mu
…
- CBSE 2024Set ANNUAL1 markMCQQ.Change in momentum is given by(a) Force x Mass(b) Force x Time(c) Force x Velocity(d) Force x Displacement
›Reveal solutionSolution
Impulse (Force x Time) equals the change in momentum — this follows directly from Newton's second law.
Newton's second law: F = dp/dt (rate of change of momentum). Rearranging for a constant force over a time interval Δt:
Δp = F x Δt
…
- CBSE 2024Set SET-NDP60001 markQ.Change in momentum is always equal to ............ (force / impulse).
›Reveal solutionSolution
The impulse–momentum theorem states that the change in momentum of a body equals the impulse applied to it: J=Δp.
Impulse is defined as the product of force and the (short) time for which it acts: J=FΔt for constant force, or J=∫Fdt in general. From Newton's second law, F=dtdp, so
J=∫Fdt=∫dtdpdt=Δp
…
🎓Unlock everything free for 14 days
- ✓Full step-by-step solutions
- ✓Concept-first explanations
- ✓Methods, shortcuts & mistakes
- ✓PYQ mapping + timed mock tests
Full access for 14 days. No credit card required.