Q.Draw a graph of potential energy V/S reaction co-ordinates showing the effect of catalyst on activation energy (E_a) of a reaction.
🔒You're viewing a preview — the full solution, concept, methods & PYQ mapping are locked.
🔒 Start your 14-day free trial to unlock the full solution →Concept understanding — Arrhenius Equation
Why reactions speed up when you heat them
You already know that most reactions go faster when you raise the temperature. The intuitive reason is simple: molecules move faster, collide more often, and collide harder. But that alone doesn't explain the dramatic jump in rate — a 10 °C rise can double or triple the rate, even though the collision frequency only increases by a few percent. Something else is at work.
The missing piece is that not every collision leads to a reaction. Only collisions with enough energy — above a certain threshold — actually break bonds and form products. That threshold is the activation energy Ea. Think of it as a hill the reactants must climb before they can roll down into products. At room temperature, only a tiny fraction of molecules have enough energy to get over that hill. Raise the temperature, and that fraction grows exponentially.
The Arrhenius equation
The Swedish chemist Svante Arrhenius captured this relationship in a single compact formula:
k=Ae−Ea/(RT)
Here:
- k is the rate constant (how fast the reaction proceeds at a given temperature)
- A is the pre-exponential factor (roughly, how often collisions happen with the right orientation)
- Ea is the activation energy (the energy barrier, in J/mol or kJ/mol)
- R is the gas constant (8.314 J/mol·K)
- T is the absolute temperature (in Kelvin)
The exponential term e−Ea/(RT) is the fraction of molecules that have energy at least Ea. This fraction is tiny when Ea is large or T is low, and it grows sharply as T increases.
Why the rate jumps so sharply with temperature
The exponential is the key. Suppose Ea=50 kJ/mol. At 300 K, the fraction is e−50000/(8.314×300)≈e−20.0≈2×10−9. At 310 K, it becomes e−50000/(8.314×310)≈e−19.4≈3.8×10−9. That's nearly double — even though the temperature rose only 3%. The collision frequency A barely changed, but the exponential term nearly doubled. That's why a small temperature rise can cause a large rate increase.
A useful rule of thumb: for many reactions near room temperature, a 10 °C rise roughly doubles the rate constant. This is a consequence of the exponential, not a law — it depends on Ea.
What A and Ea really mean
A (the pre-exponential factor) accounts for how often molecules collide and whether they're oriented correctly. It depends on the size and shape of the molecules. Ea is the minimum energy needed for a successful collision. A reaction with a high Ea is very sensitive to temperature; one with a low Ea is less sensitive.
Do not confuse Ea with the overall energy change of the reaction (ΔH). Ea is the barrier height; ΔH is the net energy difference between reactants and products. A reaction can be highly exothermic (ΔH large and negative) but still have a high Ea — that's why some exothermic reactions (like burning wood) need a spark to start.
The logarithmic form …
A catalyst provides an alternative path with a lower activation energy; this is shown on a potential-energy vs reaction-coordinate diagram. …
The PE–reaction coordinate curve has a high barrier (Ea) for the uncatalysed reaction and a lower barrier (Ea′) for the catalysed reaction; the catalyst lowers Ea.
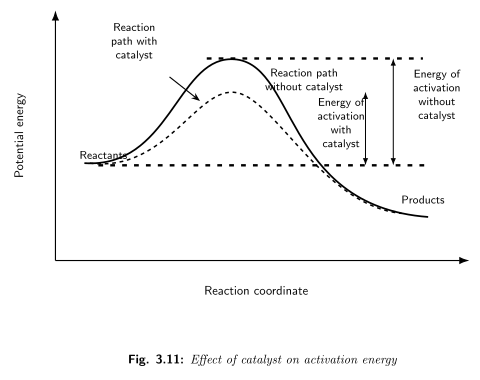
Concept. A catalyst speeds a reaction by providing an alternative reaction pathway with a lower activation energy. On a potential-energy diagram (y-axis = potential energy, x-axis = reaction coordinate), this appears as a lower energy barrier.
Diagram (described).
…
Showing the 12 most recent of 23 on this concept.
- CBSE 2026Set A1 markMCQQ.Which of the following represents the effect of temperature on reaction rate ?(a) Nernst's equation(b) Gibbs-Helmholtz equation(c) Arrhenius equation(d) Van't Hoff equation
›Reveal solutionSolution
The Arrhenius equation, k = A e^(-Ea/RT), describes how the rate constant (and hence reaction rate) depends on temperature.
The Arrhenius equation k = A e^(-Ea/RT) links the rate constant k to temperature T and activation energy Ea. It quantifies the effect of temperature on reaction rate. The Nernst equation relates electrod …
- CBSE 2026Set ANNUAL1 markMCQQ.Activation energy of a chemical reaction can be determined by(a) rate constant at standard temperature(b) rate constants at two different temperatures(c) orientation of reactant molecules during the collision(d) using catalyst
›Reveal solutionSolution
Activation energy is found from the Arrhenius equation by measuring the rate constant of a reaction at two (or more) different temperatures.
The Arrhenius equation is: k = A e^(-Ea/RT)
Taking the natural log at two temperatures T1 and T2 with rate constants k1 and k2, and subtracting, gives:
ln(k2/k1) = -(Ea/R)(1/T2 - 1/T1)
…
- CBSE 2026Set ANNUAL1 markMCQQ.The correct form of Arrhenius equation is:(a) k = e^(-Ea/RT)(b) k = Ea/RT(c) k = log_e (Ea/R)(d) k = A e^(-Ea/RT)
›Reveal solutionSolution
The Arrhenius equation is k=Ae−Ea/RT, relating the rate constant to temperature and activation energy.
The Arrhenius equation, proposed by Svante Arrhenius, expresses how the rate constant k of a reaction varies with temperature:
k=Ae−Ea/RT …
- CBSE 2026Set ANNUAL1 markMCQQ.The influence of temperature on the rate of a reaction is determined by(a) Nernst equation(b) Gibbs-Helmholtz equation(c) van't Hoff equation(d) Arrhenius equation
›Reveal solutionSolution
Of the four named equations, only the Arrhenius equation directly relates the rate constant of a reaction to temperature.
Why the others are not it:
- (a) Nernst equation: relates the EMF of an electrochemical cell to the concentrations (activities) of the species involved — an electrochemistry relationship, not a kinetics one.
- (b) Gibbs–Helmholtz equation: relates the temperature dependence of Gibbs free energy change to enthalpy and entropy changes — a thermodynamics relationship about spontaneity, not reaction rate.
- (c) van't Hoff equation: relates the equilibrium constant (Kc or Kp) to temperature — about the position of equilibrium, not how fast equilibrium is reached.
Arrhenius equation (d): …
- CBSE 2025Set X11 markQ.Arrhenius factor is also called __________ factor.
›Reveal solutionSolution
The Arrhenius factor A is also called the frequency (pre-exponential) factor.
The Arrhenius equation is k=Ae−Ea/RT, where A is the Arrhenius constant. It represents the frequency of collisions with correct orientation and is therefore cal …
- CBSE 2025Set D1 markMCQQ.The specific rate constant of a first order reaction depends upon(a) concentration of reactants(b) concentration of products(c) time(d) temperature
›Reveal solutionSolution
The rate constant depends on temperature (via the Arrhenius equation), not on concentration or time.
For a first order reaction rate = k[A]. The rate constant k is a proportionality constant characteristic of the reaction at a given temperature. According to the Arrhenius equation:
k = A e^(-Ea/RT) …
- CBSE 2025Set D1 markMCQQ.The temperature coefficient of most of the reactions lies between(a) 1 and 3(b) 2 and 3(c) 1 and 4(d) 2 and 4
›Reveal solutionSolution
Temperature coefficient of most reactions is between 2 and 3.
The temperature coefficient is the ratio of the rate constant at (T + 10) K to that at T K:
temperature coefficient = k(T+10)/k(T)
…
- CBSE 2025Set ANNUAL1 markMCQQ.Which of the following represents Arrhenius equation?(a) k = Ae^(Ea/RT)(b) k = Ae^(-Ea/RT)(c) k = Ae^(Ea/R)(d) dk = Ae^(Ea/T)
›Reveal solutionSolution
The Arrhenius equation relates the rate constant to temperature through an exponential term with a NEGATIVE activation-energy exponent.
The Arrhenius equation is:
k=Ae−Ea/RT …
- CBSE 2025Set ANNUAL1 markQ.Define : Activation energy.
›Reveal solutionSolution
Activation energy is the energy barrier reactant molecules must cross to be converted into products.
According to collision theory, not every collision between reactant molecules leads to product formation — only those collisions in which molecules possess sufficient energy (and correct orientation) are effective. The activation energy, Ea, is defined as the minimum extra energy that reactant molecules, over and above their average energy, must acquire before they can react to form products. Equivalently, it is the difference between the threshold energy (the minimum energy needed …
- CBSE 2024Set ANNUAL1 markQ.The kinetic energy of maximum fraction of reactant molecules is called ______.
›Reveal solutionSolution
On a Maxwell-Boltzmann distribution-of-energy curve, the energy value at the peak (where the curve is highest) is possessed by the largest fraction of molecules - this is called the most probable kinetic energy.
In any collection of gas/reactant molecules at a given temperature, molecules do not all have the same kinetic energy; their energies are spread out according to the Maxwell-Boltzmann distribution.
When the fraction of molecules (y-axis) is plotted against kinetic energy (x-axis), the curve rises, reaches a maximum, then falls - the energy value at this peak is the one possessed by the largest fraction of molecules, called the most probable kinetic energy. …
- CBSE 2024Set ANNUAL1 markMCQQ.Activation energy of a chemical reaction can be determined by :(a) determining the rate constant at standard temperature(b) determining the rate constant at two temperatures(c) determining probability of collision(d) using catalyst
›Reveal solutionSolution
Activation energy comes from the Arrhenius equation, which needs the rate constant measured at (at least) two temperatures to solve for Ea.
The Arrhenius equation is k=Ae−Ea/RT, or in logarithmic form:
lnk=lnA−RTEa
A single rate constant at one temperature carries two unknowns (A and Ea) and cannot be solved alone. Measuring k at two different temperatures T1 and T2 gives two equations, which combine to: …
- CBSE 2024Set ANNUAL1 markMCQQ.The activation energies of the forward and backward reactions are 15 kcal/mol and 20 kcal/mol. Then the change in ΔH is –(a) 5 kcal/mol(b) – 35 kcal/mol(c) 15 kcal/mol(d) 25 kcal/mol
›Reveal solutionSolution
Subtracting the backward activation energy from the forward one gives ΔH = −5 kcal/mol, meaning the reaction is exothermic by 5 kcal/mol.
The relationship between the enthalpy change of a reaction and the activation energies of its forward and reverse directions is:
ΔH=Ea(forward)−Ea(backward)
Substituting the given values:
ΔH=15−20=−5 kcal/mol
…
🎓Unlock everything free for 14 days
- ✓Full step-by-step solutions
- ✓Concept-first explanations
- ✓Methods, shortcuts & mistakes
- ✓PYQ mapping + timed mock tests
Full access for 14 days. No credit card required.