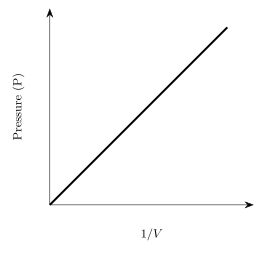
Q.(i) Geographical [graphical] representation of a gas law is given below (see figure).
You're viewing a preview — the full solution, concept, methods & PYQ mapping are locked.
Start your 14-day free trial to unlock the full solution →A straight line through the origin on a plot of P vs 1/V is the graphical signature of Boyle's Law (P directly proportional to 1/V at constant T).
(i)(a) & (b): The given graph plots Pressure (P) on the y-axis against 1/V (reciprocal of Volume) on the x-axis, and shows a straight line passing through the origin — i.e., P is directly proportional to 1/V. This is exactly the graphical statement of Boyle's Law.
Boyle's Law states: at constant temperature, the pressure of a fixed amount (fixed mass/fixed number of moles) of a gas is inversely proportional to its volume.
P ∝ 1/V (at constant T and n), or equivalently PV = constant, or P1V1 = P2V2 for two states at the same temperature. …
Unlock everything free for 14 days
- Full step-by-step solutions
- Concept-first explanations
- Methods, shortcuts & mistakes
- PYQ mapping + timed mock tests
Full access for 14 days. No credit card required.