Q.(a) Plot a graph showing variation in the concentration of reactants against time for a zero order reaction. (Score : 1)
🔒You're viewing a preview — the full solution, concept, methods & PYQ mapping are locked.
🔒 Start your 14-day free trial to unlock the full solution →Concept understanding — Integrated Rate Law First Order
Integrated Rate Law for a First-Order Reaction
Imagine you have a reaction where the rate depends only on the concentration of one reactant — double the concentration, double the rate. That’s a first-order reaction. The question is: if you start with some amount of A, how does its concentration actually decay over time? The differential rate law tells you the instantaneous speed, but the integrated rate law tells you the path the concentration follows.
The Intuition
Think of a radioactive sample. Every atom has the same fixed probability of decaying per second, regardless of how many atoms are left. So if you start with 1000 atoms, in the first second maybe 100 decay. In the next second, you have 900 left, so only 90 decay. The number decaying per second keeps dropping because there are fewer atoms to decay. The result is not a straight-line drop in concentration — it’s a curve that falls steeply at first, then flattens out. That curve is an exponential decay.
For a first-order chemical reaction, the same logic holds: the rate at any moment is proportional to how much reactant is still there. So the concentration doesn’t fall by equal amounts in equal time intervals; it falls by equal fractions in equal time intervals.
The Derivation (Short)
Start with the differential rate law for a first-order reaction:
−dtd[A]=k[A]
Rearrange so that all [A] terms are on one side and dt on the other:
[A]d[A]=−kdt
Integrate from time 0 (initial concentration [A]0) to time t (concentration [A]):
∫[A]0[A][A]d[A]=−k∫0tdt
The left side integrates to ln[A]−ln[A]0, and the right side gives −kt. So:
ln[A]−ln[A]0=−kt
Or equivalently:
ln[A]0[A]=−kt
Convert to base-10 logarithms (since lnx=2.303log10x):
log[A]0[A]=−2.303kt
Rearranging gives the form you usually see in exams:
k=t2.303log[A][A]0
The Linear Plot — The Key Insight
The equation ln[A]=ln[A]0−kt is of the form y=mx+c, where y=ln[A], m=−k, x=t, and c=ln[A]0. So if you plot ln[A] (or log[A]) against time, you get a straight line with slope −k (or −k/2.303 for base-10 logs).
This is the hallmark of a first-order reaction. If your experimental data gives a straight line when you plot log[reactant] vs. time, the reaction is first order. If it curves, it’s not.
You don’t need to know [A]0 to find k from the plot — just measure the slope. The intercept gives ln[A]0, which is a useful check.
What This Means Practically
- The half-life (t1/2) is constant for a first-order reaction. Set [A]=[A]0/2 in the integrated law: ln(1/2)=−kt1/2, so t1/2=kln2≈k0.693. It doesn’t depend on how much you started with. …
A zero-order reaction's concentration falls linearly with time, since its rate doesn't depend on concentration at all, and the rate constant for the given first-order decomposition of N2O5 follows from applying the integrated first-order rate law to the data. …
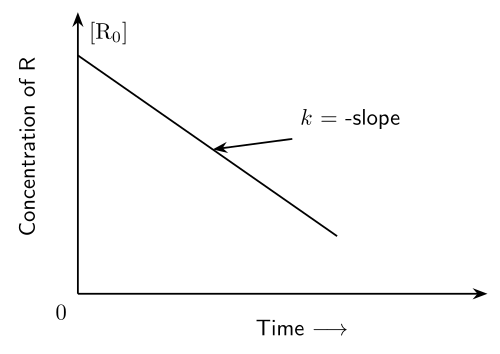
A zero order reaction's [R]-vs-t graph is a straight line of slope -k; its rate is independent of concentration; solving the given first-order kinetics data gives k ~ 1.83 h-1.
- Graph for a zero order reaction For a zero order reaction, rate = k[R]^0 = k, a constant. Integrating -d[R]/dt = k gives [R] = [R]0 - kt. So a plot of [R] (y-axis) against time t (x-axis) is a straight line with negative slope: it starts at the initial concentration [R]0 on the y-axis and falls linearly, the slope of the line being -k (so k = -slope). Unlike first-order kinetics, the line is straight (not a curve) because concentration itself, not its logarithm, decreases linearly with time.
- Meaning of zero order reaction …
- CBSE 2026Set ANNUAL1 markMCQQ.For a first order reaction the correct graph is(a) concentration [R0] (y-axis) vs time (x-axis): a curve decreasing from a high value toward zero, labelled K = - slope(b) ln[R0] (y-axis) vs time (x-axis): a straight line with negative slope, labelled K = - slope(c) concentration log[R0] (y-axis) vs time (x-axis): a straight line with positive slope starting from origin, labelled K = slope(d) concentration [R0] (y-axis) vs time (x-axis): a flat horizontal line (constant concentration)
›Reveal solutionSolution
For a first-order reaction, only a plot of ln(concentration) versus time is linear; a plot of concentration itself versus time is an exponential curve, not a straight line.
For a first-order reaction, integrating the rate law -d[R]/dt = k[R] gives:
ln[R] = ln[R]0 - kt
This is the equation of a straight line (y = mx + c) when ln[R] is plotted on the y-axis against t on the x-axis, with slope = -k, i.e. k = -slope.
- Option (a), plain concentration [R] vs t, gives a decaying curve (exponential), not a straight line. …
- CBSE 2025Set ANNUAL1 markMCQQ.If the graph of log(a - x) against 't' a straight line, the order of reaction is:(a) Zero(b) First(c) Second(d) Third
›Reveal solutionSolution
The integrated first-order rate law, k = (2.303/t) log[a/(a−x)], rearranges to log(a−x) = log a − (k/2.303)t, which is linear in t — so a straight line for log(a−x) vs t confirms first-order kinetics.
For a first-order reaction A → products, the rate law is −d[A]/dt = k[A]. Integrating with initial concentration 'a' and amount reacted 'x' at time t (so remaining concentration is a−x):
ln(a−x) = ln a − kt
⇒ log(a−x) = log a − (k/2.303) t
…
- CBSE 2023Set 56/2/11 markMCQQ.The slope in the plot of ln[R] vs. time for a first order reaction is (A) +2.303k (B) −k (C) −2.303k (D) +k
›Reveal solutionSolution
For a first-order reaction, the integrated rate law ln[R]=−kt+ln[R]0 is a straight line when ln[R] is plotted against time. The slope of this line is −k, so the correct answer is (B).
Why the Arrhenius plot idea works here
The question asks about the slope of ln[R] vs. time for a first-order reaction. This is a classic application of the integrated rate law — not the Arrhenius equation (which deals with temperature dependence of k), but the same principle of linearising an exponential decay.
A first-order reaction follows:
Rate=−dtd[R]=k[R]
When you integrate this differential equation, you get an exponential decay in concentration [R]. Taking the natural logarithm converts that exponential into a straight line — and the slope of that line tells you the rate constant.
For a first-order reaction:
ln[R]=−kt+ln[R]0
This is of the form y=mx+c, where y=ln[R], x=t, m=−k, and c=ln[R]0.
Step-by-step derivation
1. Start with the differential rate law
For a first-order reaction A→products:
−dtd[A]=k[A]
2. Separate variables and integrate
∫[A]0[A][A]d[A]=−k∫0tdt
This gives:
ln[A]−ln[A]0=−kt
3. Rearrange into straight-line form
ln[A]=−kt+ln[A]0
Compare with y=mx+c:
- y=ln[A] (vertical axis)
- x=t (horizontal axis)
- m=−k (slope)
- c=ln[A]0 (intercept)
4. Identify the slope
The slope is clearly −k. …
- CBSE 2023Set ANNUAL1 markMCQQ.Expression k = (2.303/t) log([R]0/[R]) is integrated rate equation of order of reaction -(a) Zero order(b) First order(c) Second order(d) Third order
›Reveal solutionSolution
The given logarithmic expression is the standard integrated rate law of a first-order reaction.
For a first-order reaction, rate = -d[R]/dt = k[R]. Integrating between limits [R]0 (at t=0) and [R] (at time t):
ln([R]0/[R]) = kt, or in base-10 form, k = (2.303/t) log10([R]0/[R]).
…
- CBSE 2022Set ANNUAL1 markMCQQ.The plot between ln[R] and t for first order reaction is:(a) straight line, negative slope (see figure)(b) straight line, positive slope through origin (see figure)(c) decreasing curve approaching the axis (see figure)(d) horizontal straight line (see figure)
›Reveal solutionSolution
For a first order reaction, plotting ln[R] against time gives a straight line with a negative slope equal to -k, because the integrated rate law is linear in ln[R].
For a first order reaction, Rate = k[R]
Integrating: d[R]/[R] = -k dt
On integration: ln[R] = ln[R]0 - kt
This equation has the form y = c + mx, where y = ln[R], x = t, intercept c = ln[R]0, and slope m = -k.
…
- CBSE 2020Set 56/3/11 markQ.Write the slope value obtained in the plot of ln[R] vs. time for a first order reaction.
›Reveal solutionSolution
For a first-order reaction, the plot of ln[R] versus time is a straight line with slope =−k, where k is the rate constant. The slope is negative and its magnitude gives the rate constant directly.
Why the Arrhenius Plot Works
The key insight is that first-order kinetics follows an exponential decay law. When you take the natural logarithm of the concentration, the exponential becomes linear — and the slope of that line is the rate constant (with a negative sign). This is one of the most elegant ways to determine k experimentally.
The integrated rate law for a first-order reaction is:
[R]=[R]0e−kt
where [R]0 is the initial concentration and [R] is the concentration at time t. Taking ln on both sides straightens the curve into a line.
Step-by-Step Derivation
- Start with the integrated rate law For a first-order reaction AProducts, the concentration at any time t is:
[R]=[R]0e−kt
- Take natural logarithm on both sides
ln[R]=ln([R]0e−kt)
- Use the property ln(ab)=lna+lnb
ln[R]=ln[R]0+ln(e−kt)
- Simplify ln(e−kt)=−kt
ln[R]=ln[R]0−kt
- Rearrange into slope-intercept form y=mx+c
Comparing with y=mx+c:
- y=ln[R]
- x=t
- m=−k (the slope)
- c=ln[R]0 (the y-intercept) …
- CBSE 2018Set ANNUAL1 markMCQQ.For the reaction C6H5-N2Cl --(Cu, Δ)--> C6H5-Cl + N2, half-life of this reaction is independent of concentration of reactant. After 10 minutes volume of N2 gas is 10 litre and after complete reaction 100 litre. The rate constant of the reaction in min^-1 unit is-(a) 2.303/10(b) (2.303/10) log 5.0(c) (2.303/10) log 2.0(d) (2.303/10) log 4.0
›Reveal solutionSolution
First-order gas evolution: k = (2.303/t)·log[V∞/(V∞ − Vt)]; the printed numbers (10 L at 10 min, 100 L total) give k = (2.303/10)·log(100/90), which is not any of the four options — likely a misprint.
Because the half-life is independent of concentration, the reaction is first order. For a gas-evolution first-order reaction the volume of N₂ formed measures the extent of reaction: V∞ ∝ initial reactant a, and (V∞ − Vt) ∝ remaining reactant (a − x). Hence
k = (2.303/t)·log[V∞/(V∞ − Vt)].
Substituting V∞ = 100 L, Vt = 10 L, t = 10 min:
k = (2.303/10)·log(100/90) = (2.303/10)·log(1.11) ≈ 0.0046 min⁻¹.
…
- CBSE 2018Set ANNUAL1 markMCQQ.The equation of velocity constant (K) for first order reaction is(a) K = (2.303/t) log10 [a/(a-x)](b) K = (4.306/t) log10 [a/(a-x)](c) K = (2.303/t^2) log10 [a/(a-x)](d) K = (4.306/t^2) log10 [a/(a-x)]
›Reveal solutionSolution
The integrated first-order rate law gives K = (2.303/t) log10 [a/(a-x)], so option (a) is correct.
For a first-order reaction, rate = -d[A]/dt = k[A]. On integrating between the initial concentration a (at t = 0) and (a-x) after time t (where x has reacted):
k = (1/t) ln [a/(a-x)]
Converting the natural logarithm to base 10 (ln = 2.303 log10):
…
🎓Unlock everything free for 14 days
- ✓Full step-by-step solutions
- ✓Concept-first explanations
- ✓Methods, shortcuts & mistakes
- ✓PYQ mapping + timed mock tests
Full access for 14 days. No credit card required.