Question of 37
Q.The symbol of a diode is shown in the figure :
(a) The diode is a _______. (rectifier diode / photo diode / zener diode)
(b) Draw the VI characteristics of above diode.
(c) A zener diode with Vz = 6.0 V is used for voltage regulation. The current through the load is to be 4.0 mA and that through the zener diode is 20 mA. If the unregulated input is 10.0 V, what is the value of series resistor R?
(d) What is the fundamental frequency of the ripple in a full wave rectifier circuit operating from 50 Hz mains? (Scores : ½+1½+2+1)
Kerala DhseKerala DHSE Plus Two Board 2018Subjective· 5mImportance★★★★★
0% · 0/37 Questions
You're viewing a preview — the full solution, concept, methods & PYQ mapping are locked.
Start your 14-day free trial to unlock the full solution →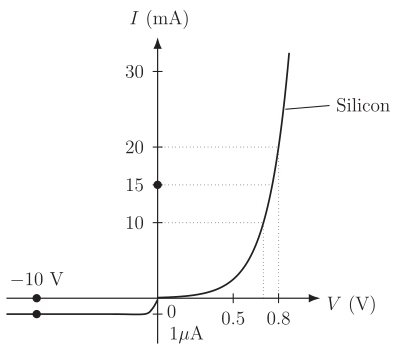
The plain triangle-and-bar symbol (no bent bar) is an ordinary rectifier diode; solving the zener circuit gives R≈167 Ω; a full-wave rectifier's ripple repeats twice per input cycle, giving 100 Hz for 50 Hz mains.
- Identifying the diode The figure shows the standard p-n junction diode symbol — a filled triangle (anode) pointing to a straight vertical bar (cathode). A zener diode's symbol is drawn with the cathode bar bent (Z/S-shaped) to distinguish it, and a photodiode symbol has incoming arrows showing light falling on the junction. Since the given symbol is the plain, unbent triangle-and-bar, it represents an ordinary rectifier diode.
- V-I characteristics (description)
- Forward bias: For small forward voltages the current is negligible; beyond a threshold ('knee') voltage (≈0.7 V for Si, ≈0.3 V for Ge) the current rises steeply and almost linearly with voltage.
- Reverse bias: Only a very small, almost constant reverse saturation current flows as reverse voltage increases, until the breakdown voltage is reached, beyond which current increases sharply.
The graph is plotted as current (mA scale, forward) vs voltage in the first quadrant, and reverse current (μA scale) vs reverse voltage in the third quadrant, with a sharp knee near breakdown.
(c) Finding the series resistor R
…
Unlock everything free for 14 days
- Full step-by-step solutions
- Concept-first explanations
- Methods, shortcuts & mistakes
- PYQ mapping + timed mock tests
Full access for 14 days. No credit card required.