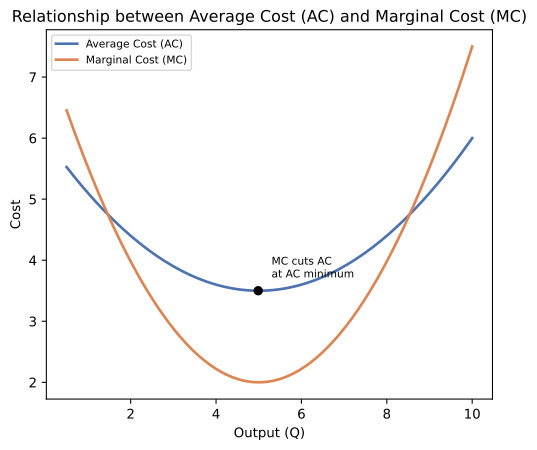
Q.What are the relationship between Average Cost and Marginal Cost curves. Illustrate it with the help of diagram.
You're viewing a preview — the full solution, concept, methods & PYQ mapping are locked.
Start your 14-day free trial to unlock the full solution →Two independent answers below — the AC-MC relationship with its diagram description, OR the definitions and diagrammatic relationship of AR and MR.
Part 1 — Relationship between Average Cost (AC) and Marginal Cost (MC):
Average Cost (AC) = Total Cost ÷ Output (TC/Q); Marginal Cost (MC) = addition to Total Cost from producing one more unit (ΔTC/ΔQ). Both AC and MC curves are typically U-shaped in the short run, due to the law of variable proportions, but their relationship follows a precise pattern:
- When MC is less than AC, AC is falling. As long as the cost of producing an additional unit (MC) is below the existing average, adding that unit pulls the average down.
- When MC is greater than AC, AC is rising. Once the marginal unit costs more than the current average, adding it pulls the average up.
- When MC equals AC, AC is at its minimum point. This happens exactly where the rising MC curve intersects the AC curve from below, at the lowest point of the AC curve.
Diagram (described): On a graph with Cost on the Y-axis and Output on the X-axis, draw the U-shaped AC curve and the U-shaped MC curve, with MC falling faster and lying below AC initially (to the left), both reaching their lowest points with MC's minimum occurring at a smaller output than AC's minimum. MC cuts AC exactly at AC's lowest point, rising thereafter and lying above AC to the right of that intersection. This is because MC captures the rate of change, so it reacts to changes in productivity before the average does.
OR
Part 2 — Average Revenue (AR) and Marginal Revenue (MR):
Average Revenue (AR) is the revenue earned per unit of output sold: AR = Total Revenue (TR) ÷ Quantity sold (Q). AR is identical to the price of the commodity, since TR = Price × Quantity, so AR = Price.
Marginal Revenue (MR) is the addition to Total Revenue from selling one more unit of output: MR = ΔTR/ΔQ.
Relationship (diagrammatic):
- Under perfect competition, the firm is a price-taker, so price remains constant whatever quantity it sells. Hence AR = MR = Price, and both the AR and MR curves coincide as a single horizontal straight line parallel to the output axis. …
Unlock everything free for 14 days
- Full step-by-step solutions
- Concept-first explanations
- Methods, shortcuts & mistakes
- PYQ mapping + timed mock tests
Full access for 14 days. No credit card required.