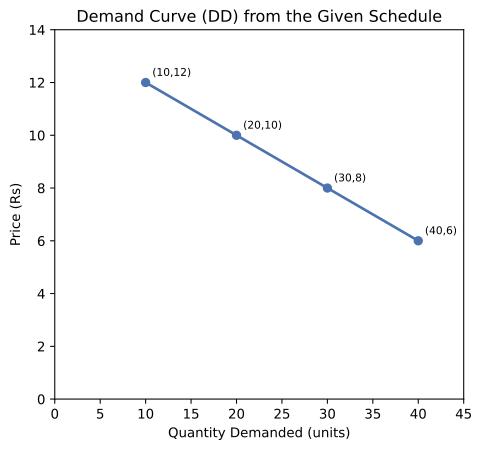
Q.Draw a demand curve representing the following information.
Price (Rs) | Quantity demanded (units)
12 | 10
10 | 20
8 | 30
6 | 40
🔒You're viewing a preview — the full solution, concept, methods & PYQ mapping are locked.
🔒 Start your 14-day free trial to unlock the full solution →Concept understanding — Market Demand Aggregation
Market Demand Aggregation
The Everyday Intuition
Imagine you run a small stall selling samosas near a school. You don't care about what one particular student wants — you care about what all the students together want. If 50 students each want 2 samosas, you need to make 100. That's aggregation: adding up individual wants to see the total demand you face.
Now scale this up. A market isn't one person's wish list — it's the sum of everyone's wish lists at every possible price. Market demand aggregation is simply the process of adding together the quantities demanded by all individual buyers at each price level.
The Precise Meaning
Market demand is the total quantity of a good that all consumers in a market are willing and able to buy at various prices, over a given time period.
The key idea: we don't just add up quantities at one price — we add up entire demand schedules (or curves) across all consumers.
Qm(P)=∑i=1nqi(P)
Where:
- Qm(P) = market quantity demanded at price P
- qi(P) = quantity demanded by consumer i at price P
- n = total number of consumers in the market
How It Works: A Simple Example
Suppose a market has only two consumers, A and B.
| Price (₹) | A's demand (units) | B's demand (units) | Market demand (units) |
|---|---|---|---|
| 10 | 5 | 3 | 8 |
| 8 | 8 | 6 | 14 |
| 6 | 12 | 9 | 21 |
| 4 | 17 | 13 | 30 |
At each price, we simply add horizontally: Qm=qA+qB. This is called horizontal summation of individual demand curves.
Why It Matters
For firms: A business doesn't produce for one customer — it produces for the market. Knowing market demand tells a firm how much to produce at each price, and how revenue will change if price changes.
For policymakers: Taxes, subsidies, and price controls affect everyone. Market demand helps predict total consumption changes. For example, if the government imposes a ₹2 tax on samosas, market demand tells us how many fewer samosas will be bought in total.
For understanding markets: The market demand curve is what interacts with market supply to determine equilibrium price and quantity. Without aggregation, we can't analyse how markets actually work.
The Law of Demand Holds for Market Demand Too …
Plotting price against quantity demanded from this schedule produces a straight, downward-sloping demand line. …
Plotting Price (Y-axis) against Quantity demanded (X-axis) from the given demand schedule and joining the points gives a straight, downward-sloping demand curve (DD), illustrating the Law of Demand.
Demand schedule (points to plot, as Quantity, Price):
(10, 12), (20, 10), (30, 8), (40, 6)
How to draw: Take Quantity demanded (units) along the horizontal (X) axis and Price (Rs) along the vertical (Y) axis. Plot each of the four (Quantity, Price) pairs as a point, then join the points with a straight line. Because price falls by a constant Rs. 2 for every constant 10-unit rise in quantity demanded, the resulting demand curve DD is a straight line sloping downward from upper-left (12, 10) to lower-right (6, 40), confirming the inverse price–quantity rel …
- CBSE 2026Set ANNUAL1 markQ.What is the most important determinant of consumer demand?
›Reveal solutionSolution
The single most important determinant of consumer demand is the good's own price.
A consumer's demand for a commodity depends on several factors — the consumer's income, prices of related goods, tastes and preferences — but the most important determinant is the price of the good itself. Other things remaining constant, the law of demand states that as the own price falls the quantity demanded rises, and as the price rises the quantity demanded falls. Hence own price is the key determinant of dem …
- CBSE 2025Set MARCH1 markQ.If the demand curves of two consumers are d1(P) = 20 - P and d2(P) = 15 - P respectively, find out the market demand curve.
›Reveal solutionSolution
Adding the two individual demand curves gives market demand D(P) = 35 - 2P.
The market demand curve is the horizontal summation of individual demand curves — at each price we add the quantities each consumer demands.
Given:
- Consumer 1: d1(P) = 20 - P
- Consumer 2: d2(P) = 15 - P
Market demand D(P) = d1(P) + d2(P) = (20 - P) + (15 - P) = 35 - 2P.
…
- CBSE 2025Set ANNUAL1 markMCQQ.Which element is essential for demand? (A) Desire to consume (B) Given price (C) Willingness to spend factor (D) All of these
›Reveal solutionSolution
Demand requires desire for the good, a given price, and willingness plus ability to spend — all of these together — so the answer is (D).
A mere wish to have a commodity is not demand. Effective demand in economics requires: (i) a desire to consume the good, (ii) reference to a given price at which it is wanted, and (iii) the willingness and ability (purchasing power) to pay that price. Only when desire is backed by wi …
- CBSE 2025Set ANNUAL1 markMCQQ.Which of the following is a determinant of demand for a good? (A) Price of good (B) Consumer taste (C) Consumer preference (D) All of these
›Reveal solutionSolution
Price of the good, consumer taste and consumer preference are all determinants of demand, so (D) is correct.
In the RBSE/CBSE Class-12 consumer-behaviour chapter, the quantity demanded of a good depends on several factors:
- Price of the good itself — the main determinant (law of demand).
- Consumer's taste — a stronger taste raises demand.
- Consumer's preference — preferences shape how much is bought. …
- CBSE 2024Set ANNUAL1 markMCQQ.Demand curve generally slopes (A) Upward from left to right (B) Parallel to x-axis (C) Downward from left to right (D) Vertical
›Reveal solutionSolution
The demand curve generally slopes downward from left to right, so the answer is (C).
In the BSEB Inter Class-12 Economics syllabus, the law of demand states that, other things remaining constant, a fall in price raises quantity demanded and a rise in price lowers it — price and quantity demanded are inversely related. Plotted with price on the y-axis and quantity on the x-axis, this inverse relation gives a demand curve that **slopes down …
- CBSE 2024Set ANNUAL1 markMCQQ.For a change in which of the following, there is no change in demand? (A) Change in price (B) Change in income (C) Change in taste and fashion (D) None of these
›Reveal solutionSolution
A change in the good's own price causes a change in quantity demanded, not a change in demand, so the answer is (A).
In the BSEB Inter Class-12 Economics syllabus, a careful distinction is made between change in quantity demanded (a movement along the same demand curve, caused only by a change in the good's own price) and change in demand (a shift of the whole demand curve, caused by changes in income, tastes/fashion, prices of related goods, etc.). Therefore a change in the good's own price does not s …
- CBSE 2024Set ANNUAL1 markMCQQ.Demand curve shows the relationship between:(a) Cost and Price(b) Price and Sales(c) Cost and Revenue(d) Demand and Price
›Reveal solutionSolution
A demand curve shows the relationship between the quantity demanded of a good and its price, so the answer is (d).
A demand curve is a graphical representation of the demand schedule; it shows the relationship between the price of a commodity and the quantity demanded of it, other things remaining constant. Price is taken on the vertical axis and quantity demanded on the horizontal axis. Because of the i …
- CBSE 2023Set ANNUAL1 markMCQQ.In the case of normal goods, demand curve shows(a) positive slope(b) negative slope(c) zero slope(d) none of these
›Reveal solutionSolution
The demand curve for a normal good is downward-sloping, i.e. it has a negative slope, so the answer is (b).
For a normal good the Law of Demand applies: as price falls, quantity demanded rises, and as price rises, quantity demanded falls. This inverse relationship means that when we plot price on the vertical axis and quantity on the horizontal axis, the demand …
- CBSE 2022Set ANNUAL1 markMCQQ.(ix) The Demand function is (A) X = f(K) (B) X = f(L) (C) X = f(P) (D) X = f(Q)
›Reveal solutionSolution
The demand function is X = f(P) — option (C).
The demand function shows the functional relationship between the quantity demanded of a commodity (X) and its own price (P), assuming other determinants (income, tastes, prices of related goods) stay constant. Hence X = f(P). H …
- CBSE 2022Set ANNUAL1 markQ.Fill in the blank:(v) The ______ is the total demand of all the consumers.
›Reveal solutionSolution
The total demand of all consumers is market demand.
Market demand is obtained by horizontally summing the individual demands of all consumers in the market at each price. It shows the total quantity of a commodity that all buyers together are willing to purchas …
🎓Unlock everything free for 14 days
- ✓Full step-by-step solutions
- ✓Concept-first explanations
- ✓Methods, shortcuts & mistakes
- ✓PYQ mapping + timed mock tests
Full access for 14 days. No credit card required.