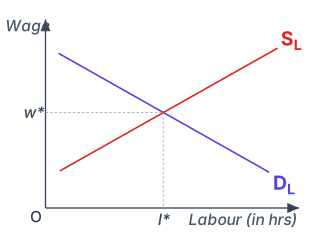
Q.What happens to labour market equilibrium if the demand curve for labour shifts to the left? Show the condition with the help of a neat diagram.
🔒You're viewing a preview — the full solution, concept, methods & PYQ mapping are locked.
🔒 Start your 14-day free trial to unlock the full solution →Concept understanding — Jobless Growth
When the Economy Grows but Jobs Don't
We usually assume that if a country produces more, it must be hiring more people to produce it. For much of history that was true. But in the modern Indian economy a puzzling pattern has emerged: output climbs year after year, yet the number of jobs barely moves. Economists have a name for this — jobless growth.
Jobless Growth = a situation in which an economy experiences a rise in its Real Gross Domestic Product (GDP) without a corresponding (adequate) rise in employment opportunities.
The word real matters — we mean genuine growth in output measured at constant prices, not a mere rise caused by inflation.
How Can Output Rise Without Jobs?
The key lies in how the extra output is produced. Growth can come from producing more per worker rather than from employing more workers:
- Capital-intensive and automated technology — machines, software and mechanisation replace human labour, so firms produce more with the same or fewer people.
- Rising labour productivity — better methods and skills let each worker produce more.
- Structural shift toward less labour-absorbing sectors — growth concentrated in sectors (like some services and modern manufacturing) that need fewer workers per unit of output.
We can express the idea simply as a gap between two growth rates:
Growth of Real GDP>Growth of Employment
When output grows faster than jobs, the additional GDP is being generated largely by higher productivity or capital — not by putting more hands to work.
Why It Is a Concern for India
India has a large and youthful labour force entering the market each year. If growth does not create enough jobs:
- Unemployment and underemployment persist despite a healthy GDP figure.
- The demographic dividend — the advantage of having a large working-age population — risks turning into a burden. …
If labour demand shifts left with supply unchanged, both the equilibrium wage rate and the equilibrium quantity of labour employed fall.
…
Demand-for-labour shift left → lower equilibrium wage AND lower equilibrium employment.
In the labour market, the wage rate (W) is measured on the Y-axis and the quantity of labour (L) on the X-axis. The demand curve for labour (D) slopes downward (firms demand less labour at a higher wage) and the supply curve of labour (S) slopes upward, intersecting at the initial equilibrium E1 giving wage W1 and employment L1.
If the demand curve for labour shifts to the left (D1 → D2) — e.g., due to a fall in demand for the firm's product, or technology that needs less labour — while the supply curve (S) stays unchanged, the new intersection point is E2, which lies below and to the left of E1. At E2:
- The equilibrium wage rate falls from W1 to a lower W2.
- The equilibrium quantity of labour employed falls from L1 to a lower L2. …
- CBSE 2025Set 58/4/11 markMCQQ.Suppose an economy is experiencing a situation of rise in Real Gross Domestic Product (GDP), without any corresponding rise in the employment opportunities. In economic parlance, such a situation is termed as __________ growth. (Choose the correct option to fill in the blank) (A) casual (B) informal (C) formal (D) jobless
›Reveal solutionSolution
The question describes a rise in real GDP without a rise in employment — this is the classic definition of jobless growth, where output expands but the labour market does not absorb additional workers.
The key here is to understand what real GDP measures versus what it does not. Real GDP tracks the total value of goods and services produced in an economy, adjusted for inflation. But it says nothing about how that output is generated — whether through more workers, more hours from existing workers, or higher productivity from the same number of people.
When an economy grows without creating new jobs, it means the existing workforce (or capital) is producing more per person. This can happen due to technological upgrades, automation, better training, or shifts toward capital-intensive industries. The output rises, but the employment numbers stay flat or even fall.
Watch outA common mistake is to confuse this with "informal" or "casual" growth — those terms refer to the type of employment (unregulated, temporary), not the relationship between output and jobs. The blank specifically asks for the term describing growth without employment gains. …
- CBSE 2025Set 58/5/11 markMCQQ."Suppose an imaginary economy is experiencing a situation of rise in Real Gross Domestic Product (GDP), without any corresponding adequate rise in the employment opportunities in the economy." In economic parlance, such a situation is termed as ________ growth. (Choose the correct option to fill in the blank) (A) Casual (B) Informal (C) Formal (D) Jobless
›Reveal solutionSolution
When real GDP rises but employment does not grow proportionately, the economy experiences jobless growth — expansion driven by capital-intensive sectors or productivity gains that fail to absorb the labor force.
The question describes a disconnect between two macroeconomic indicators that we normally expect to move together: output and employment. In a typical expansion, rising GDP reflects increased production, which in turn requires more workers — factories hire, services expand, construction picks up. But the scenario here breaks that link: real GDP climbs while employment opportunities stagnate or grow far more slowly.
This phenomenon has a specific name in economics. Jobless growth (or jobless recovery, when it follows a recession) captures exactly this pattern: the economy grows, profits may rise, and aggregate output increases, yet the labor market remains sluggish. The growth is real — it shows up in national accounts — but it bypasses a large segment of the population because it does not translate into jobs.
Why does this happen? Several structural forces can drive jobless growth:
- Capital-intensive expansion: Growth concentrated in sectors like IT, finance, or automated manufacturing that rely on technology and capital rather than labor. A software firm can double its revenue with minimal hiring; a steel plant can boost output by upgrading machinery without adding workers.
- Productivity improvements: Firms produce more with the same workforce through better technology, management, or processes. Output per worker rises, so GDP grows even if headcount does not.
- Sectoral composition: If growth is led by industries with low employment elasticity (the responsiveness of employment to output growth), the aggregate job creation will be weak. India's experience in the 2000s, for instance, saw strong GDP growth driven by services and capital-intensive industry, while labor-intensive sectors like agriculture and small-scale manufacturing lagged.
Watch outDo not confuse jobless growth with a fall in employment. Employment may still be rising in absolute terms, but at a rate far below what the GDP growth would historically predict. The issue is the inadequacy of job creation relative to output expansion and the size of the labor force entering the market. …
- CBSE 2025Set ANNUAL1 markMCQQ.Identify the type of unemployment in which people are employed only during a part of the year(a) disguised(b) seasonal(c) structural(d) frictional
›Reveal solutionSolution
This describes seasonal unemployment, where people are employed only during a particular part of the year because the activity that gives them work does not run all year round.
Unemployment in the Indian labour market is usually classified into several types, based on why people are without work:
- Disguised unemployment — more people are engaged in a task than are actually needed; even if some were withdrawn, output would not fall (common in Indian agriculture, where family members share farm work that could be done by fewer hands).
- Seasonal unemployment — work is available only in a particular season of the year, because the underlying activity itself is seasonal. For example, farm labourers may have abundant work during sowing and harvesting but little or none in between; workers in ice factories may be idle through winter.
- Structural unemployment — arises from a persistent mismatch between the skills workers have and the skills the changing structure of the economy demands (e.g., due to technological change or a shift away from certain industries). …
- CBSE 2024Set 58/2/11 markMCQQ.Read the following statements: Assertion (A) and Reason (R). Choose the correct alternative from those given below: Assertion (A): In the recent past, Indian economy has been facing the problem of jobless growth. Reason (R): Jobless growth refers to a situation where an economy is able to produce more goods and services without generating additional employment. Alternatives: (A) Both Assertion (A) and Reason (R) are true and Reason (R) is the correct explanation of Assertion (A). (B) Both Assertion (A) and Reason (R) are true, but Reason (R) is not the correct explanation of Assertion (A). (C) Assertion (A) is true, but Reason (R) is false. (D) Assertion (A) is false, but Reason (R) is true.
›Reveal solutionSolution
Both the Assertion and the Reason are factually correct, but the Reason merely defines jobless growth — it does not explain why the Indian economy has faced it — so R is not the correct explanation of A. The answer is (B).
To answer this, first grasp what “jobless growth” means. It is the term economists use when an economy’s output — the total value of goods and services produced — rises steadily, but the number of jobs available does not keep pace. The economy grows on paper (GDP goes up), yet that growth fails to absorb the growing workforce into productive employment.
Now look at the Assertion: “In the recent past, Indian economy has been facing the problem of jobless growth.” This is a well-documented observation in the CBSE Class 12 Indian Economic Development / employment topic. Over the last couple of decades India’s GDP growth has been respectable, yet employment generation has lagged, as manufacturing and services became more capital-intensive rather than labour-intensive. So the Assertion is true.
The Reason states: “Jobless growth refers to a situation where an economy is able to produce more goods and services without generating additional employment.” That is the textbook definition — precise and accurate. So the Reason is also true. …
- CBSE 2024Set ANNUAL1 markMCQQ.Statement I : maximum number of people are working as self-employed in both rural and urban areas Statement II : the second major source of work is regular salaried category. Which of the following options is correct about the given statement?(a) Statement I is correct and statement II is incorrect(b) Statement I is incorrect and statement II is correct(c) Both the statements are correct(d) Both the statements are incorrect
›Reveal solutionSolution
Statement I (self-employment is the largest work category nationwide) is true; Statement II (regular salaried is the second-largest category) is false — casual labour, not regular salaried work, is the second-largest category overall.
India's workforce is conventionally divided into three employment categories: self-employed, regular salaried/wage employees, and casual labourers. Labour force survey data consistently show:
- Self-employment is the single largest category of work in both rural and urban India — people working on their own account or in family enterprises (including cultivators and small traders) make up over half the workforce. This confirms Statement I. …
- CBSE 2022Set ANNUAL1 markQ.What is the difference between 'Labour Force' and 'Work Force'?
›Reveal solutionSolution
Labour Force is a broader concept than Work Force — it additionally includes job-seekers who are currently unemployed.
Labour Force refers to the total number of persons in the economically active age group who are either currently employed or are unemployed but actively seeking and available for work. Work Force, by contrast, refers only to the persons who are actually engaged in some productive economic activity — i.e., currently employed.
The relationship between the two can be expressed as:
Labour Force = Work Force + Unemployed persons (seeking work)
…
🎓Unlock everything free for 14 days
- ✓Full step-by-step solutions
- ✓Concept-first explanations
- ✓Methods, shortcuts & mistakes
- ✓PYQ mapping + timed mock tests
Full access for 14 days. No credit card required.