Q.Draw the binding energy per nucleon curve and in it, mark the positions of 1H2 and Fe. (1+21+21=2) OR An α-particle and a proton are accelerated through the same potential difference. Find the ratios of their velocities.
🔒You're viewing a preview — the full solution, concept, methods & PYQ mapping are locked.
🔒 Start your 14-day free trial to unlock the full solution →Concept understanding — Nuclear Binding Energy per Nucleon
The Intuition: Why Are Nuclei Stuck Together?
Imagine a nucleus as a tight cluster of protons and neutrons. Protons all carry positive charge, so they should be violently repelling each other. Yet the nucleus holds together. That means there must be an even stronger attractive force — the strong nuclear force — acting between nucleons (protons and neutrons). But here's the catch: this force is extremely short-range. A nucleon only feels the pull from its immediate neighbours, not from nucleons far across the nucleus.
So the nucleus is a tug-of-war. The strong force pulls nucleons together, but the electrostatic repulsion between protons tries to blow the nucleus apart. For a nucleus to be stable, the strong force must win.
Now, if you want to break a nucleus apart into its individual protons and neutrons, you have to do work against the strong force — you have to supply energy. That energy, once supplied, is stored in the separated nucleons as extra mass. This is the core idea: the mass of a stable nucleus is always less than the sum of the masses of its individual protons and neutrons. The missing mass is called the mass defect, and the energy equivalent of that missing mass (via E=mc2) is the binding energy.
Binding energy is the energy you must put in to completely separate a nucleus into its constituent nucleons. It is not energy stored inside the nucleus like fuel; it is the energy that holds the nucleus together.
The Precise Statement
For a nucleus with Z protons, N neutrons, and mass mnucleus:
Mass defect Δm=Zmp+Nmn−mnucleus
where mp and mn are the masses of a free proton and neutron. Then the total binding energy is:
BE=Δmc2
But a big nucleus has more nucleons, so its total binding energy will naturally be larger. To compare how tightly bound different nuclei are, we use binding energy per nucleon:
BE/A=ABE
where A=Z+N is the mass number. This is the average energy you'd need to remove one nucleon from the nucleus. A higher BE/A means a more stable nucleus.
The Famous Curve: Why Iron is Special
If you plot BE/A against mass number A, you get a curve that rises steeply for light nuclei, peaks at iron-56 (about 8.8 MeV per nucleon), and then slowly falls for heavier nuclei.
Iron-56 has the highest binding energy per nucleon of any nuclide. It is the most stable nucleus in nature.
This shape tells you two things:
1. Fusion of light nuclei releases energy. If you take two very light nuclei (like hydrogen isotopes) and smash them together to form a medium-mass nucleus, the product has a higher BE/A than the reactants. The difference in binding energy is released as kinetic energy of the products. This is how stars burn.
2. Fission of heavy nuclei releases energy. If you split a very heavy nucleus (like uranium-235) into two medium-mass fragments, those fragments also have higher BE/A than the original. Again, the difference comes out as energy. This is how nuclear reactors work. …
Main part: On the binding-energy-per-nucleon vs. mass-number curve, 1H2 (deuterium, A=2) sits very low on the steeply-rising left end (BE/A≈1.1 MeV), while Fe (A≈56) sits at the peak of the curve (BE/A≈8.8 MeV, the most stable region). …
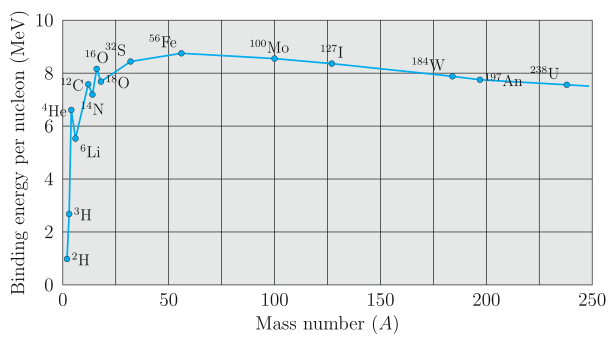
The binding-energy-per-nucleon curve rises steeply from very light nuclei, peaks near iron (A≈56, the most stable nucleus), and falls slowly for heavier nuclei; deuterium sits near the low, steeply-rising start of the curve while iron sits at its peak.
Describing the binding energy per nucleon (BE/A) vs. mass number (A) curve
If we plot BE/A (in MeV) on the vertical axis against mass number A on the horizontal axis:
- The curve starts at (or near) the origin for the lightest nuclei (A=1, no binding for a lone proton), then rises steeply through the very light nuclei.
- 1H2 (deuterium, A=2) sits at a low point on this steep initial rise: its binding energy per nucleon is only about 1.1 MeV — one of the lowest values on the whole curve, reflecting that the deuteron is only loosely bound compared to typical medium-mass nuclei.
- The curve continues rising with some fluctuations (e.g. a local peak at 2He4, ≈7.1 MeV) through light and medium nuclei, reaching a broad maximum around A≈56, where BE/A≈8.7–8.8 MeV.
- Fe (iron, A≈56) sits essentially at this peak — the most tightly bound, most stable region of the whole curve.
- Beyond the peak, the curve decreases slowly as A increases further (down to about 7.6 MeV for very heavy nuclei like uranium, A≈238).
So on a rough sketch: mark a point very low and far to the left for 1H2 (near A=2, BE/A≈1.1 MeV), and mark the topmost point of the curve, roughly in the middle of the horizontal axis, for Fe (near A=56, BE/A≈8.8 MeV — the highest point on the whole graph).
…
Showing the 12 most recent of 15 on this concept.
- CBSE 2026Set 55/1/11 markMCQQ.For questions 13 to 16, two statements are given – one labelled Assertion (A) and the other labelled Reason (R). Select the correct answer from the codes (A), (B), (C) and (D) below: (A) Both Assertion (A) and Reason (R) are true and Reason (R) is the correct explanation of the Assertion (A). (B) Both Assertion (A) and Reason (R) are true, but Reason (R) is not the correct explanation of the Assertion (A). (C) Assertion (A) is true, but Reason (R) is false. (D) Both Assertion (A) and Reason (R) are false. Assertion (A) : The mass of a nucleus is less than the sum of the masses of the constituent nucleons. Reason (R) : Energy is absorbed when the nucleons are bound together to form a nucleus.
›Reveal solutionSolution
The key idea is mass defect: the mass of a stable nucleus is always less than the sum of its individual nucleon masses because the binding energy released during formation reduces the total mass. The Assertion is true, but the Reason is false — energy is released, not absorbed, when nucleons bind.
This question tests your understanding of mass defect and binding energy — two of the most beautiful consequences of Einstein’s mass-energy equivalence, E=mc2.
When nucleons (protons and neutrons) come together to form a nucleus, they attract each other via the strong nuclear force. To pull them apart into isolated nucleons, you must supply energy — that energy is called the binding energy. Conversely, when they bind, that same amount of energy is released into the surroundings (usually as gamma rays).
Here’s the crucial link: because energy is released, the system loses mass. The mass of the bound nucleus is less than the sum of the masses of its individual nucleons. This missing mass, multiplied by c2, exactly equals the binding energy. That’s the mass defect.
Now let’s examine each statement carefully.
-
Assertion (A): “The mass of a nucleus is less than the sum of the masses of the constituent nucleons.”
This is a well-established experimental fact for every stable nucleus. For example, a helium-4 nucleus has mass 4.0026 u, but two protons and two neutrons add up to 4.0330 u. The difference (0.0304 u) is the mass defect. So Assertion (A) is true.
-
Reason (R): “Energy is absorbed when the nucleons are bound together to form a nucleus.” …
-
- CBSE 2026Set ANNUAL1 markQ.If the binding energy of oxygen nucleus 16/8 O is 128 MeV, then calculate the binding energy per nucleon.
›Reveal solutionSolution
Binding energy per nucleon is simply the total binding energy divided by the number of nucleons (mass number A).
For 16/8 O, mass number A = 16 (8 protons + 8 neutrons), and total binding energy = 128 MeV (given). …
- CBSE 2026Set ANNUAL1 markMCQQ.Which of the following statements is true regarding the stability of a nucleus?(a) Binding energy alone determines nuclear stability.(b) Binding energy per nucleon is a better indicator of nuclear stability than total binding energy.(c) Neither binding energy nor binding energy per nucleon is related to nuclear stability.(d) Only the number of protons and neutrons determine nuclear stability.
›Reveal solutionSolution
Total binding energy grows almost monotonically with the number of nucleons and so cannot distinguish stability between nuclei of different sizes; binding energy per nucleon — which rises, peaks near iron (A≈56), and then falls for heavier nuclei — is the quantity that correctly tracks relative nuclear stability.
Why total binding energy is a poor stability measure
Binding energy (BE) is the energy required to completely separate a nucleus into its individual protons and neutrons (equivalently, the energy released when the nucleus is assembled from free nucleons):
BE=[Zmp+(A−Z)mn−Mnucleus]c2
As the mass number A (number of nucleons) increases, there are simply more nucleon–nucleon bonds contributing to the total, so total BE tends to increase with A across the periodic table — a very heavy nucleus like uranium has a much larger total binding energy than a light nucleus like helium, purely because it has far more nucleons, not necessarily because each individual nucleon is more tightly (stably) bound.
Why binding energy per nucleon is the right measure
Binding energy per nucleon, BE/A, measures the average energy binding each individual nucleon into the nucleus — this is what actually reflects how stable/tightly bound the nucleus is, independent of how many nucleons it happens to have.
When BE/A is plotted against A:
- It rises steeply for light nuclei, …
- CBSE 2026Set ANNUAL1 markMCQQ.The mass of a 37Li nucleus is 0.042 u less than the sum of the masses of all its nucleons. The average binding energy per nucleon of 37Li nucleus is nearly :(a) 23 MeV(b) 46 MeV(c) 5.6 MeV(d) 3.9 MeV
›Reveal solutionSolution
Converting the given mass defect to energy and dividing by the 7 nucleons of 37Li gives a binding energy per nucleon of about 5.6 MeV.
Working
Total binding energy: BE=Δm×931.5 MeV/u (using E=mc2 with mass in atomic mass units).
Given Δm=0.042 u:
BE=0.042×931.5≈39.12 MeV
…
- CBSE 2025Set 55/5/11 markMCQQ.Assertion (A): During the formation of a nucleus, the mass defect produced is the source of the binding energy of the nucleus. Reason (R): For all nuclei, the value of binding energy per nucleon increases with mass number. (A) Both A and R are true and R is the correct explanation of A. (B) Both A and R are true, but R is not the correct explanation of A. (C) A is true, but R is false. (D) Both A and R are false.
›Reveal solutionSolution
The mass defect does provide the binding energy (A is true), but binding energy per nucleon does not increase monotonically with mass number—it peaks around iron-56 and then decreases (R is false). The answer is (C).
Understanding Mass Defect and Binding Energy
When protons and neutrons come together to form a nucleus, something remarkable happens: the mass of the resulting nucleus is less than the sum of the masses of its constituent nucleons. This "missing" mass hasn't vanished—it has been converted into energy that holds the nucleus together.
Einstein's mass-energy equivalence E=mc2 tells us that mass and energy are interchangeable. The mass defect Δm is precisely the source of the binding energy:
BE=Δm⋅c2
This binding energy is what you would need to supply to completely disassemble the nucleus back into separate protons and neutrons. The assertion (A) captures this fundamental principle correctly.
The Binding Energy Per Nucleon Curve
Now let's examine the reason (R), which claims that binding energy per nucleon increases with mass number for all nuclei. This is where we need to look at experimental data.
The binding energy per nucleon, ABE (where A is the mass number), does not increase monotonically. Instead, it follows a characteristic curve:
-
Light nuclei (hydrogen, helium): relatively low binding energy per nucleon, around 1–7 MeV.
-
Medium nuclei (iron-56, nickel-62): the curve reaches its maximum at approximately 8.8 MeV per nucleon. Iron-56 sits near the peak of nuclear stability.
-
Heavy nuclei (uranium, plutonium): the binding energy per nucleon decreases to around 7.5 MeV.
ImportantThe binding energy per nucleon curve peaks around A≈56 (iron) and then decreases for heavier elements. This is why both fusion (combining light nuclei) and fission (splitting heavy nuclei) release energy—both processes move toward the more stable middle region.
Region Mass Number Range BE/nucleon Trend Light A<20 1–7 MeV Increasing Medium 20<A<100 7.5–8.8 MeV Peak around Fe-56 Heavy A>100 7.5–8 MeV Decreasing The decrease in binding energy per nucleon for heavy nuclei occurs because: …
-
- CBSE 2025Set X11 markMCQQ.Binding energy per nucleon of a nucleus is a measure of its(a) radius(b) mass(c) volume(d) stability
›Reveal solutionSolution
(d) stability The binding energy per nucleon (BE/A) tells how tightly each nucleon is bound. A higher BE/A means more energy is needed to remove a nucleon, so the nucleus is more stable. It is …
- CBSE 2024Set ANNUAL1 markQ.Which nucleus has maximum average binding energy per nucleon?
›Reveal solutionSolution
The binding-energy-per-nucleon curve peaks around mass number A ≈ 56, at iron — the most tightly bound (most stable) nucleus.
The average binding energy per nucleon, BE/A, is plotted against mass number A to give the famous 'binding energy curve'. Its shape is:
- It rises steeply for light nuclei (He, Li, Be, ...).
- It reaches a broad maximum for nuclei with A roughly between 50 and 80, peaking at about 8.8 MeV per nucleon near A ≈ 56, which corresponds to iron (and its close neighbours like nickel).
- It then slowly decreases for heavier nuclei, dropping to about 7.6 MeV/nucleon for uranium (A ≈ 238). …
- CBSE 2024Set ANNUAL1 markQ.Which element in the periodic table shows maximum binding energy per nucleon ?
›Reveal solutionSolution
Binding energy per nucleon peaks around mass number A≈56, at iron — this is why iron is exceptionally stable and is the endpoint of energy-releasing fusion in stars.
The binding energy per nucleon (BE/A) of a nucleus measures how tightly its nucleons are bound — the higher this value, the more stable the nucleus (more energy would be needed to pull it apart, nucleon by nucleon).
When BE/A is plotted against mass number A for all known nuclei, the curve rises steeply for light nuclei, reaches a broad maximum of about 8.7–8.8 MeV per nucleon in the region A≈50–60, and then slowly decreases for heavier nuclei. The peak of this curve is at iron-56 (26Fe56, closely followed by nickel-62 which is marginally higher, but iron is the standard textbook answer), which is why: …
- CBSE 2024Set ANNUAL1 markMCQQ.The generation of energy in the sun is mainly due to :(a) Fission of heavy nuclei(b) Fission of light nuclei(c) Fusion of heavy nuclei(d) Fusion of light nuclei
›Reveal solutionSolution
The Sun's energy comes from nuclear fusion of light nuclei (hydrogen into helium).
Inside the Sun's core, at extremely high temperature and pressure, light hydrogen nuclei (protons) fuse together in a chain of reactions (the proton-proton cycle) to form helium nuclei. The mass of the helium formed is slightly less than the mass of the hydrogen nuclei …
- CBSE 2023Set 55/3/11 markMCQQ.Two statements are given – one labelled Assertion (A) and the other labelled Reason (R). Select the correct answer from the codes (a), (b),(c) and(d) below.(a) Both Assertion (A) and Reason (R) are true and Reason (R) is the correct explanation of the Assertion (A).(b) Both Assertion (A) and Reason (R) are true, but Reason (R) is not the correct explanation of the Assertion (A).(c) Assertion (A) is true, but Reason (R) is false.(d) Assertion (A) is false and Reason (R) is also false. Assertion (A) : The nucleus 37X is more stable than the nucleus 34Y. Reason (R) : 37X contains more number of protons.
›Reveal solutionSolution
The assertion is true because 37X has a higher binding energy per nucleon than 34Y (both are isotopes of lithium, and 7Li is more stable than 4Li). The reason is false — more protons do not guarantee greater stability; in fact, 34Y has the same number of protons as 37X. So the correct option is (c).
The key here is to understand what "more stable" means for a nucleus. Stability of a nucleus is measured by its binding energy per nucleon — the energy required to remove one nucleon from the nucleus. A higher binding energy per nucleon means the nucleus is more tightly bound and therefore more stable.
Now look at the two nuclei: 37X and 34Y. Both have the same atomic number Z=3, so they are isotopes of the same element — lithium. The first has mass number A=7, the second A=4.
The reason claims that 37X is more stable because it "contains more number of protons." But both have exactly 3 protons — the number of protons is identical. So the reason is factually wrong. Even if it were about more nucleons, that alone doesn't guarantee stability; you need to look at the binding energy curve.
Let’s walk through the reasoning step by step.
-
Identify the nuclei.
37X has 3 protons and 4 neutrons. 34Y has 3 protons and 1 neutron. Both are lithium isotopes: 7Li and 4Li.
-
Check the stability of 4Li.
4Li is extremely unstable — it has a half-life of about 10−22 seconds and decays almost instantly. It lies far from the valley of stability because the neutron-to-proton ratio is too low (1 neutron for 3 protons). In contrast, 7Li is stable — it is one of the two stable isotopes of lithium (the other being 6Li).
-
Binding energy per nucleon comparison. …
-
- CBSE 2023Set 55/4/11 markMCQQ.The difference in mass of a 7X nucleus and total mass of its constituent nucleons is 21.00 u. The binding energy per nucleon for this nucleus is equal to the energy equivalent of : (A) 3 u (B) 3.5 u (C) 7 u (D) 21 u
›Reveal solutionSolution
The mass defect of 21.00 u for a nucleus with 7 nucleons corresponds to a total binding energy. The binding energy per nucleon is found by dividing the mass defect by the number of nucleons, which gives 3 u as its mass equivalent.
Concept and Intuition
At the heart of nuclear physics lies the concept that the mass of a nucleus is less than the sum of the masses of its individual constituent protons and neutrons (collectively called nucleons). This difference in mass is known as the mass defect (Δm).
This "missing" mass is not actually lost; instead, it has been converted into energy according to Einstein's famous mass-energy equivalence principle, E=mc2. This energy is called the binding energy (EBE) of the nucleus. It represents the energy required to break the nucleus apart into its individual nucleons, or conversely, the energy released when the nucleons combine to form the nucleus.
The binding energy per nucleon is a crucial quantity for understanding nuclear stability. It is simply the total binding energy divided by the total number of nucleons (A) in the nucleus. A higher binding energy per nucleon generally indicates a more stable nucleus.
In this problem, we are given the mass defect directly. We need to find the binding energy per nucleon and express it as an "energy equivalent of X u". This means we are looking for a mass value X such that X⋅c2 is equal to the binding energy per nucleon. Essentially, we need to calculate the mass defect per nucleon.
Step-by-Step Solution
-
Identify the given mass defect:
The problem states that the difference in mass of the nucleus and the total mass of its constituent nucleons (which is the definition of mass defect) is 21.00 u.
So, the mass defect Δm=21.00 u.
-
Determine the number of nucleons (A):
The nucleus is denoted as 7X. In standard nuclear notation, ZAX, A represents the mass number (total number of nucleons) and Z represents the atomic number (number of protons). If only one number is given as a subscript, it typically refers to Z. However, the question asks for "binding energy per nucleon", which requires knowing the total number of nucleons, A. Given the options, and the common practice in such problems, it is implied that the number 7 refers to the mass number A. If Z=7 were intended, the mass number A would be unknown, making the problem unsolvable. Therefore, we take the number of nucleons A=7.
-
Calculate the total binding energy (EBE):
The total binding energy is related to the mass defect by Einstein's mass-energy equivalence:
EBE=Δm⋅c2
Substituting the given mass defect:
EBE=21.00 u⋅c2 …
-
- CBSE 2021Set TERM21 markMCQQ.Assertion: If a heavy nucleus is split into two medium sized parts, each of the nuclei will have more binding energy per nucleon than the original nucleus. Reason: Joining two light nuclei together to give a single nucleus of medium size means more binding energy per nucleon than the two nuclei.(a) if both assertion and reason are true and reason is the correct explanation of the assertion(b) if both assertion and reason are true, but reason is not correct explanation of the assertion(c) if assertion is true, but reason is false(d) if both assertion and reason are false
›Reveal solutionSolution
Both statements are true and both follow from the shape of the binding-energy-per-nucleon curve, but the reason describes fusion (light nuclei joining) while the assertion is about fission (a heavy nucleus splitting) — a different process, so it isn't a direct explanation of it.
Assertion: True. The binding-energy-per-nucleon curve rises for light nuclei, peaks near mass number A≈56 (iron region), then falls gradually for heavy nuclei. So when a heavy nucleus splits into two medium-mass fragments, each fragment (closer to the peak) has higher binding energy per nucleon than the original heavy nucleus — exactly what releases energy in nuclear fission.
…
🎓Unlock everything free for 14 days
- ✓Full step-by-step solutions
- ✓Concept-first explanations
- ✓Methods, shortcuts & mistakes
- ✓PYQ mapping + timed mock tests
Full access for 14 days. No credit card required.