Q.Draw the position-time graphs for two objects A & B with a) equal velocities b) unequal velocities c) opposite velocities.
🔒You're viewing a preview — the full solution, concept, methods & PYQ mapping are locked.
🔒 Start your 14-day free trial to unlock the full solution →Concept understanding — One Dimensional Motion
One Dimensional Motion
Imagine you're standing on a long, perfectly straight railway track. A train moves along it — it can only go forward or backward. It cannot turn left, right, up, or down. That's the core idea: motion confined to a single straight line.
The Intuition
In the real world, a ball thrown across a room moves in three dimensions — it goes forward, sideways, and up-down. But many problems in physics are simpler. We deliberately restrict motion to one dimension (1D) to understand the fundamental laws without the clutter of angles and curves.
Think of:
- A car moving on a straight highway (no turns).
- A lift going up or down a shaft.
- A ball dropped straight down from a height.
- A puck sliding on a frictionless straight track.
In each case, the object's position can be described by just one number — its distance from a fixed point (the origin) along that line.
The Precise Statement
One Dimensional Motion is motion in which the position of an object can be completely described using a single coordinate axis (usually the x-axis or y-axis). The object moves only along that straight line.
This means:
- The path is a straight line.
- The direction is either positive (say, to the right or upward) or negative (left or downward).
- All vector quantities (displacement, velocity, acceleration) have only two possible directions — forward or backward.
The Three Key Quantities
To describe 1D motion precisely, we use three quantities:
-
Position (x or y) — where the object is relative to the origin.
Example: x=+5 m means 5 metres to the right of the origin.
-
Displacement (Δx) — change in position:
Δx=xfinal−xinitial
This is a vector — it has a sign. If you move from x=2 m to x=7 m, Δx=+5 m. If you move back to x=3 m, Δx=−4 m.
- Velocity (v) — rate of change of position:
v=ΔtΔx
Average velocity has a sign. Instantaneous velocity is the slope of the position-time graph.
- Acceleration (a) — rate of change of velocity:
a=ΔtΔv
Again, a signed quantity. Positive acceleration doesn't always mean speeding up — it means velocity is becoming more positive (or less negative).
The Equations of Motion (Constant Acceleration)
For the special (and very common) case of constant acceleration, we have three equations that connect these quantities. They are the equations of motion for 1D:
v=u+at
s=ut+21at2
v2=u2+2as
Where:
- u = initial velocity
- v = final velocity
- a = constant acceleration
- t = time
- s = displacement
These equations only work when acceleration is constant. If acceleration changes, you cannot use them directly — you'd need calculus or graphical methods.
A Simple Example …
On an x–t graph, slope represents velocity: equal velocities give two parallel straight lines (same slope); unequal velocities give straight lines of different slope (possibly crossing); opposite velocities give lines of opposite-signed slope (one rising, one falling). …
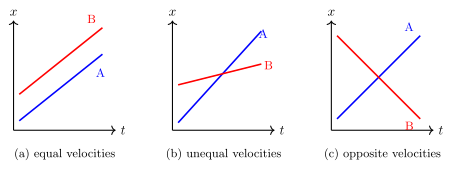
On a position–time graph, the slope of the line is the object's velocity, so equal/unequal/opposite velocities correspond directly to equal/different/oppositely-signed slopes.
For an object moving with constant velocity, its position-time (x–t) graph is a straight line whose slope equals that velocity.
- Equal velocities: Both A and B have straight-line x–t graphs with the same (nonzero) slope. The two lines are parallel — they may start at different positions (different y-intercepts), but the vertical gap between them stays constant for all time, since neither ever catches up to or falls behind the other at a changing rate.
- Unequal velocities: A and B have straight lines of different slopes. If they start from different positions, the lines will cross at exactly one point (where the two objects momentarily have the same position) unless prevented by physical constraints; the object with the steeper slope has the greater speed. …
Showing the 12 most recent of 28 on this concept.
- CBSE 2026Set ANNUAL1 markMCQQ.Which of the following is an example of non-uniform motion?(a) A car travelling at a constant speed on a straight road(b) A car accelerating from rest(c) A car maintaining a steady speed around a circular track(d) A car coming to a stop at a traffic light
›Reveal solutionSolution
Non-uniform motion is motion in which speed changes with time (unequal distances in equal time intervals). A car speeding up from rest is the standard textbook example.
Uniform motion = constant speed, equal distances covered in equal time intervals (option a and, in the basic sense taught in this chapter, option c -- uniform circular motion at constant speed -- are both treated as "uniform" speed cases here).
Non-uniform motion = speed is NOT constant -- the object covers unequal distances in equal time intervals.
- (a) Constant speed on a straight road -- uniform motion.
- (b) Accelerating from rest -- speed rises continuously from 0, a clean, unambiguous case of non-uniform motion. This is the example most commonly used in this chapter to introduce accelerated (non-uniform) motion. …
- CBSE 2026Set ANNUAL1 markQ.What does the area under velocity-time graph represents?
›Reveal solutionSolution
Area under a v-t graph = displacement, because vdt (a thin vertical strip's area) is exactly the small displacement dx.
Velocity is defined as v=dtdx, so a small displacement over a tiny time interval dt is dx=vdt. On a velocity-time graph, vdt is precisely the area of a thin vertical strip of width dt and height v. Summing (integrating) all such strips from time t1 to t2 gives:
Δx=∫t1t2vdt=area under the v-t graph between t1 and t2
…
- CBSE 2026Set sz1 markMCQQ.The area under velocity-time graph represents:(a) acceleration(b) force(c) displacement(d) work
›Reveal solutionSolution
The area under a v-t graph gives displacement, since displacement = integral of velocity dt.
Displacement s = integral of v dt over the time interval. Geometrically, this integral is exactly the area bounded by the velocity curve and the time axis (with sign, since …
- CBSE 2026Set ANNUAL1 markMCQQ.The area enclosed by velocity-time graph with time axis represents -(a) velocity(b) displacement(c) acceleration(d) work
›Reveal solutionSolution
The area under a velocity-time graph, between the curve and the time axis, equals the displacement of the body.
For a small time interval dt, if the velocity is v, the small displacement covered is dx = v × dt — exactly the area of a thin vertical strip of the v-t graph of height v and width dt. Adding up (integrating) all such strips between two times t1 and t2 gives the total displacement:
x = ∫ v dt (from t1 to t2) …
- CBSE 2026Set ANNUAL1 markMCQQ.For which of the following position-time (x-t) graphs acceleration is zero ?(a) concave-upward (U-shaped) x-t curve(b) dome-shaped (concave-downward) x-t curve(c) straight line rising with time(d) oscillating wave-like x-t curve
›Reveal solutionSolution
Only a straight-line x-t graph gives constant velocity and zero acceleration. Answer (C).
In a position-time graph:
- the slope (dx/dt) gives velocity,
- if the slope changes with time, the velocity changes, meaning there is acceleration.
A curved x-t graph (concave up, dome-shaped, or oscillating) has a continuously changing slope, so the velocity changes and acceleration is non-zero. …
- CBSE 2026Set ANNUAL1 markMCQQ.The area under the velocity-time (v-t) graph of a moving body represents(a) velocity of the body(b) acceleration of the body(c) kinetic energy of the body(d) displacement of the body
›Reveal solutionSolution
Area under a v-t graph = displacement. Answer (D).
On a velocity-time graph, a small strip of width dt and height v has area v dt. Summing (integrating) all such strips gives the total displacement:
displacement = integral of v dt = area under the v-t curve.
…
- CBSE 2025Set ANNUAL1 markMCQQ.Which of the following is an example of non-uniform motion?(a) A car travelling at a constant speed on a straight road(b) A car accelerating from rest(c) A car maintaining a steady speed around a circular track(d) A car coming to a stop at a traffic light
›Reveal solutionSolution
Non-uniform motion means the body covers unequal distances in equal time intervals, i.e. its speed changes with time -- exactly what happens as a car accelerates from rest.
Uniform motion: a body covers equal displacements in equal intervals of time, moving at constant speed along a straight path -- option (a) is uniform motion.
Non-uniform (accelerated) motion: the speed changes with time. A car accelerating from rest goes from 0 speed to increasing speed over time -- unequal distances are covered in successive equal time intervals -- so this is the clearest, textbook example of non-uniform motion.
…
- CBSE 2025Set ANNUAL1 markQ.Answer in one word or one sentence: What does the slope of velocity-time graph represent?
›Reveal solutionSolution
The slope of a v-t graph gives the instantaneous acceleration.
Acceleration is defined as the rate of change of velocity with time, a = dv/dt. On a velocity-time (v-t) graph, the slope at any point is exactly dv/dt at that instant. So the slope of the v-t graph directly represents the instantaneous acceleration of the particle — a steeper slope means larger acceleration, a negative slope means deceleration (or acceleration op …
- CBSE 2025Set ANNUAL1 markQ.State True or False: A particle in one-dimensional motion with zero speed may have non-zero velocity.
›Reveal solutionSolution
The statement is False: zero speed always means zero velocity.
Speed is defined as the magnitude of the velocity vector: speed = |velocity|. If the speed of a particle is zero, then the magnitude of its velocity vector is zero, and a vector with zero magnitude is the zero vector itself — it has no direction and represents no motion. Therefore a …
- CBSE 2025Set sz1 markMCQQ.When the distance travelled by a body is proportional to the time taken, what happens to its speed? (A) Becomes zero (B) Increases (C) Remains the same (D) Decreases
›Reveal solutionSolution
Distance proportional to time (s = kt) implies a constant velocity, so the speed remains the same.
If the distance travelled s is directly proportional to time t, we can write s=kt where k is a constant.
Speed is the rate of change of distance: v=dtds=k, which is a constant independent of time. …
- CBSE 2025Set ANN1 markMCQQ.A graph of position-time of an object is given. Choose the correct answer related to this graph.(a) velocity of object increases(b) object is stationary(c) object has constant velocity
›Reveal solutionSolution
A straight-line position-time graph has a constant slope, so the object moves with constant (uniform) velocity.
On a position-time (x-t) graph, the instantaneous velocity at any instant equals the slope of the graph at that point: v = dx/dt.
…
- CBSE 2025Set ANNUAL1 markMCQQ.The given position-time graph indicates, [graph shown: x vs t, curve concave up, increasing slope](a) (A) positive acceleration(b) (B) negative acceleration(c) (C) zero acceleration(d) (D) uniform velocity
›Reveal solutionSolution
[!TLDR]
(A) positive acceleration
Why
An x-t graph that curves upward with increasing slope has an increasing velocity, i.e., po …
🎓Unlock everything free for 14 days
- ✓Full step-by-step solutions
- ✓Concept-first explanations
- ✓Methods, shortcuts & mistakes
- ✓PYQ mapping + timed mock tests
Full access for 14 days. No credit card required.