Q.Draw the diagram of total revenue curve for a firm.
🔒You're viewing a preview — the full solution, concept, methods & PYQ mapping are locked.
🔒 Start your 14-day free trial to unlock the full solution →Concept understanding — Marginal Revenue Constant
Marginal Revenue Constant: When Every Extra Unit Earns the Same
Think about a lemonade stand. On a hot day, you sell the first glass for ₹20. The second glass? Still ₹20. The third? ₹20 again. Every time you sell one more glass, your total revenue goes up by exactly ₹20. That ₹20 is your marginal revenue — and it stays the same no matter how many glasses you sell.
That is the simplest case of constant marginal revenue. But in economics, this situation is special, not automatic. Let's see why.
The Precise Meaning
Marginal Revenue (MR) is the change in total revenue when you sell one additional unit of output.
MR=ΔQΔTR
Where:
- ΔTR = change in total revenue
- ΔQ = change in quantity sold (usually 1 unit)
When MR is constant, it means every extra unit you sell adds exactly the same amount to your total revenue. The number does not change as you sell more.
When Does MR Stay Constant?
This happens only when the firm can sell any quantity at the same price — that is, when the firm is a price taker. In perfect competition, the market sets the price, and the individual firm cannot influence it. So:
MR=P
The marginal revenue from selling one more unit is simply the market price. And since the price does not change with the firm's output, MR is constant.
In perfect competition, MR=AR=P at every level of output. The MR curve is a horizontal straight line at the market price.
Why It Matters
Constant MR changes how a firm thinks about profit. If MR is constant, the firm's total revenue is a straight line:
TR=P×Q
Every extra unit adds exactly P to revenue. So the firm's decision to produce more depends entirely on whether the marginal cost of that unit is less than or greater than this constant MR.
If MR is constant but MC is rising (as it usually does), the firm will keep producing until MR=MC. That is the profit-maximising output.
The Contrast: When MR Is Not Constant
Most real-world firms face downward-sloping demand. To sell more, they must lower the price on all units. So the extra revenue from selling one more unit is less than the price — MR falls as output rises. That is the world of monopoly, monopolistic competition, and oligopoly. …
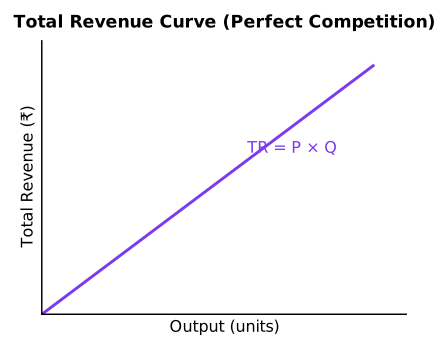
For a firm under perfect competition the price is constant, so total revenue (TR = Price × Quantity) rises in direct proportion to output. Its total revenue curve is therefore an upward-sloping straight line starting from the origin. …
Under perfect competition price is constant, so TR = P × Q is an upward-sloping straight line from the origin.
In the RBSE/CBSE Class-12 chapter on the firm under perfect competition, the firm is a price-taker — it sells any quantity at the same ruling market price (P). Therefore total revenue is:
TR = Price × Quantity = P × Q
Since P is constant, TR increases by the same amount (P) for each additional unit sold.
How to draw it:
- Axes: X-axis = output/quantity (Q); Y-axis = total revenue (TR).
- Shape: A straight line starting from the origin and sloping upward to the right.
- Slope: The slope of the line equals the price P (which is also the constant marginal revenue, MR = AR = P). …
Showing the 12 most recent of 25 on this concept.
- CBSE 2026Set ANNUAL1 markMCQQ.The necessary condition for a perfectly competitive firm is A) MR = AR = P B) MR > AR > P C) MR < AR < P D) P ≠ AR > MR
›Reveal solutionSolution
For a perfectly competitive firm, MR = AR = P, so the answer is A.
In a perfectly competitive market there are many firms selling an identical product, and each firm is a price-taker that can sell any quantity at the market-determined price. Because every unit is sold at the same price, average revenue (total revenue ÷ quantity) equals that price, and the revenue from one more unit ( …
- CBSE 2026Set ANNUAL1 markQ.What is meant by total revenue?
›Reveal solutionSolution
Total revenue is price times quantity sold: TR = P × Q.
Total Revenue (TR) is the total amount of money a firm earns from the sale of its output. It is calculated by multiplying the price per unit (P) by the number of units sold (Q): TR = P × Q. For example, selling 100 units at ₹5 each gives TR = ₹500. Total revenue, along with total cost, determines the firm's profit, so it is a basic revenue concept in the …
- CBSE 2026Set ANNUAL1 markMCQQ.The shape of average revenue curve in monopoly is(a) Upward rising(b) U-shaped(c) Downward sloping(d) S-shaped
›Reveal solutionSolution
Under monopoly the average revenue (demand) curve is downward sloping, so the answer is (c).
Under monopoly there is a single seller facing the entire market demand. To sell a larger quantity the monopolist must lower the price, so average revenue (which equals price) falls as output increases. Therefore the AR curve of a monopolist slopes downward from left to right …
- CBSE 2025Set MARCH1 markMCQQ.Average Revenue (AR) =(a) TR/Q(b) TP/Q(c) TC/Q(d) P/Q
›Reveal solutionSolution
Average Revenue = TR/Q — option (a).
…
- CBSE 2025Set ANNUAL1 markMCQQ.In which market may Marginal Revenue become zero or negative? (A) Monopoly (B) Monopolistic competition (C) Both (A) and (B) (D) Perfect competition
›Reveal solutionSolution
Marginal revenue can become zero or negative in both monopoly and monopolistic competition, so the answer is (C) Both (A) and (B).
When a firm faces a downward-sloping demand curve (as in monopoly and in monopolistic competition), it must reduce the price on all units to sell an additional unit. Because of this, the extra revenue from one more unit — the marginal revenue (MR) — falls faster than price, and beyond a certain output MR becomes zero and then negative.
…
- CBSE 2025Set ANNUAL1 markMCQQ.Which of the following will be true for both Monopoly and Monopolistic competition? (A) P > MR (B) P = MR (C) P = MC (D) P = AC
›Reveal solutionSolution
Under both monopoly and monopolistic competition, price (AR) is greater than marginal revenue, so the answer is (A) P > MR.
A firm in monopoly or monopolistic competition faces a downward-sloping demand (AR) curve. To sell an extra unit it lowers price on every unit, so the marginal revenue earned from the extra unit is less than the price received. Therefore Price (= Average Revenue) is always greater than Marginal Revenue, i.e. P > MR.
…
- CBSE 2025Set ANNUAL1 markMCQQ.Average Revenue equals to (A) Total revenue divided by the quantity produced (B) Price (C) Both (A) and (B) (D) None of these
›Reveal solutionSolution
Average revenue equals total revenue divided by quantity, which also equals price, so the answer is (C) Both (A) and (B).
Average Revenue (AR) is the revenue a firm earns per unit of output sold. By definition, AR = Total Revenue / Quantity. Since Total Revenue = Price x Quantity, dividing by quantity gives AR = Price.
…
- CBSE 2025Set ANNUAL1 markMCQQ.Which one of the following is true? In perfectly competitive market, the:(a) Average Revenue (AR) = Marginal Revenue (MR)(b) Average Revenue (AR) > Marginal Revenue (MR)(c) Average Revenue (AR) < Marginal Revenue (MR)(d) Average Revenue (AR) = Total Revenue (TR)
›Reveal solutionSolution
In a perfectly competitive market AR = MR, so the answer is (a).
Under perfect competition a firm is a price-taker: it can sell any quantity at the single ruling market price. So each additional unit is sold at the same price, which means the price received per unit (Average Revenue) is constant and equals the addition to total revenue from the last unit (Margina …
- CBSE 2025Set ANNUAL1 markQ.Fill in the blank: The slope of the total revenue curve is always ______.
›Reveal solutionSolution
The slope of the TR curve is always positive (constant and equal to price for a price-taker).
Total revenue TR = Price × Quantity. As more units are sold, TR increases, so the slope of the total revenue curve is always positive. For a price-taking firm (perfect competition) the price is constant, so TR rises by the same amount (the price) for every extra unit — the TR curve is an **upward-sloping straight line through the origin with a constant positi …
- CBSE 2025Set ANNUAL1 markMCQQ.Change in total revenue / Change in quantity = ?(a) Average revenue(b) Total cost(c) Marginal revenue(d) None of these(a) Average revenue(b) Total cost(c) Marginal revenue(d) None of these
›Reveal solutionSolution
MR = ΔTR/ΔQ — the extra revenue earned from selling one additional unit of output.
Total Revenue (TR) = Price × Quantity sold. As a firm sells one more unit, Total Revenue changes by some amount, ΔTR; the ratio of this change in TR to the (always one-unit) change in quantity, ΔQ, gives Marginal Revenue: MR = ΔTR/ΔQ. This is distinct from Average Revenue (AR = TR/Q, i.e., price per unit) and Total …
- CBSE 2025Set ANNUAL1 markMCQQ.The change in total revenue earned by a firm on account of sale of an additional unit of output during a given period of time is called ______ .(a) Marginal Revenue(b) Total Revenue(c) Average Revenue(d) Total Profit
›Reveal solutionSolution
The change in total revenue from selling one more unit of output is called Marginal Revenue (MR).
Revenue concepts in the theory of the firm:
- Total Revenue (TR) = Price × Quantity sold — the whole amount earned from all units sold.
- Average Revenue (AR) = TR ÷ Q — revenue earned per unit sold (equal to price under perfect competition).
- Marginal Revenue (MR) = ΔTR/ΔQ = TRn − TRn−1 — the ADDITIONAL revenue earned by selling ONE more (an extra/marginal) unit of output. …
- CBSE 2024Set MARCH1 markMCQQ.The increase in total revenue for a unit increases in the output is(a) a) Marginal revenue(b) b) Average revenue(c) c) Total revenue(d) d) Fixed revenue
›Reveal solutionSolution
The change in total revenue from selling one extra unit is marginal revenue, so the answer is (a).
Total revenue (TR) is price multiplied by quantity sold. Average revenue (AR) is revenue per unit (TR/Q), which equals price. Marginal revenue (MR) is the extra revenue earned by selling one additional unit, i.e. MR=ΔTR/ΔQ. Since the question asks for the increase in total revenue for a one-unit increase in output …
🎓Unlock everything free for 14 days
- ✓Full step-by-step solutions
- ✓Concept-first explanations
- ✓Methods, shortcuts & mistakes
- ✓PYQ mapping + timed mock tests
Full access for 14 days. No credit card required.