Q.What is meant by market demand? Explain the derivation of market demand curve with the help of a diagram. OR Why does the demand curve shift? Clarify shift in the demand curve and movement along the demand curve.
You're viewing a preview — the full solution, concept, methods & PYQ mapping are locked.
Start your 14-day free trial to unlock the full solution →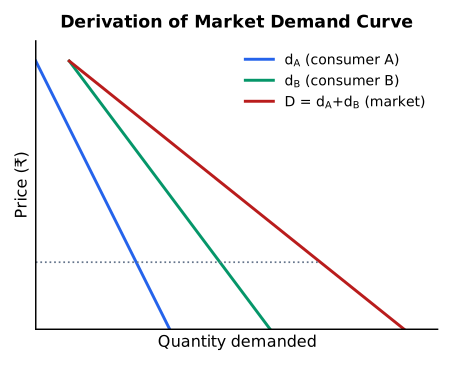
Market demand = total quantity demanded by all consumers at each price; the market demand curve is the horizontal summation of individual demand curves.
In the RBSE/CBSE Class-12 consumer-behaviour chapter, market demand for a good is the total quantity that all consumers in the market together are willing and able to buy at each possible price, other things remaining constant.
Derivation (horizontal summation):
The market demand curve is obtained by horizontally adding up the individual demand curves — i.e. at every given price, we add the quantities demanded by each individual consumer.
Numerical illustration (two consumers A and B):
| Price (₹) | Demand of A (units) | Demand of B (units) | Market Demand (A + B) |
|---|---|---|---|
| 10 | 2 | 3 | 5 |
| 8 | 4 | 5 | 9 |
| 6 | 6 | 7 | 13 |
How to draw it:
- Axes: X-axis = quantity; Y-axis = price.
- Draw each consumer's downward-sloping demand curve (DA and DB). …
Unlock everything free for 14 days
- Full step-by-step solutions
- Concept-first explanations
- Methods, shortcuts & mistakes
- PYQ mapping + timed mock tests
Full access for 14 days. No credit card required.