Q.The figure shows a region (directed into the plane of the paper) with a uniform, time-independent magnetic field B. A rectangular conducting wire loop of area A is initially placed completely inside this magnetic-field region. The loop is then pulled out of the field with constant velocity V⃗. Assume the loop starts leaving the field at time t = t1 and has completely left the field at time t = t2. Which of the graphs below correctly represents how the EMF induced in the loop varies with time?
🔒You're viewing a preview — the full solution, concept, methods & PYQ mapping are locked.
🔒 Start your 14-day free trial to unlock the full solution →Concept understanding — Motional Emf
Motional Emf
When a conductor moves through a magnetic field, the free charges inside it experience a magnetic force. This force pushes the charges along the conductor, setting up a potential difference across its ends — a motional emf. It is electromagnetic induction viewed from a moving conductor rather than from a changing field.
Origin: the Lorentz force
Consider a straight rod of length l moving with velocity v perpendicular to a uniform field B. Each free charge q feels a force
F=q(v×B)
of magnitude qvB directed along the rod. Charges pile up at the ends until the electric field they create balances the magnetic force. The resulting potential difference — the motional emf — is
ε=Bvl
Consistency with Faraday's law
Let the rod of length l slide along parallel conducting rails, sweeping out a distance x. The enclosed area is A=lx, so the flux is Φ=Blx. Then
ε=−dtdΦ=−Bldtdx=−Blv
The magnitude Bvl matches the Lorentz-force result, showing that the flux rule and the force picture agree.
Worked example
A rod of length 0.4m moves at 5m/s perpendicular to a field of 0.5T:
ε=Bvl=0.5×5×0.4=1V
If the circuit resistance is 2Ω, the induced current is I=ε/R=0.5A.
Force and energy …
Why this formula?
Motional EMF: Why the Formula Holds
Let's build this from first principles — understanding the why before the formula.
The Core Idea
Motional EMF arises when a conductor moves through a magnetic field. The key insight: moving charges in a magnetic field experience a magnetic force, which acts like a battery pushing charges around the conductor.
Step 1: The Force on a Moving Charge
A charge q moving with velocity v in a magnetic field B feels the Lorentz magnetic force:
Fm=q(v×B)
This force is perpendicular to both velocity and magnetic field.
Step 2: What Happens Inside a Moving Conductor
Consider a straight metal rod of length L moving with constant velocity v perpendicular to a uniform magnetic field B (pointing into the page).
- Free electrons in the rod are moving with the rod at velocity v.
- Each electron experiences a magnetic force:
Fm=−e(v×B)
(negative sign because electron charge is −e)
- This force pushes electrons along the rod — say, toward one end.
Step 3: Charge Separation Creates an Electric Field
As electrons accumulate at one end, that end becomes negatively charged, leaving the other end positively charged.
- This charge separation creates an internal electric field E inside the rod, pointing from positive to negative end.
- The electric field exerts an opposing force on the electrons:
Fe=−eE
Step 4: Equilibrium — The "Battery" is Formed
Charge keeps moving until the electric force balances the magnetic force:
Fe+Fm=0
−eE−e(v×B)=0
E=−(v×B)
Magnitude-wise (for perpendicular v and B):
E=vB
Step 5: From Electric Field to EMF
The motional EMF E is the work done per unit charge to move a test charge from one end to the other:
E=∫negativepositiveE⋅dl
For a uniform field along the rod of length L:
E=E⋅L=vBL
The Key Formula
Motional EMF for a straight conductor moving perpendicular to B:
E=BLv
Why This Makes Physical Sense
| Quantity | Role |
|---|---|
| B | Stronger magnetic field → larger force on charges |
| L | Longer conductor → more charge separation possible |
While the loop lies wholly inside or wholly outside the field its flux is constant so no emf appears, but during the steady exit the enclosed area shrinks at a constant rate, which gives a steady, non-zero emf for that interval only. …
While the loop is fully inside or fully outside the field, flux is constant and EMF is zero; while it is exiting at constant velocity, the enclosed area (and hence flux) falls at a constant rate, giving a constant (non-zero) EMF between t1 and t2 — a flat rectangular pulse.
Before t1, the loop is entirely inside the uniform field, so the flux Φ = BA is constant and the induced EMF, ε = -dΦ/dt, is zero. Between t1 and t2, the loop is partway out: since it moves at constant velocity V, the area still inside the field shrinks at a constant rate (dA/dt = -Vb, where b is the loop's width perpendicular to V), so
ε=−dtdΦ=−BdtdA=BVb=constant …
- CBSE 2026Set ANNUAL1 markMCQQ.A bicycle wheel with 10 spokes is rotating at a rate of 2 Cycle Per Second perpendicular to the horizontal component of the earth's magnetic field. This produces an induced emf 'E' between the axle and rim of the wheel. If the number of spokes is doubled, then the value of induced emf will be(a) 4E(b) 2E(c) E(d) E/2
›Reveal solutionSolution
Each spoke is an independent conducting rod rotating about the same axle in the same field, so each develops the SAME emf; connecting more of them in parallel between axle and rim does not add up their emfs, so E stays unchanged.
For a single conducting rod of length R rotating with angular speed omega in a field B (perpendicular to the plane of rotation), the motional emf between the centre and the rim is E = (1/2) B omega R^2. Every spoke, being identical in length and rotating at the same rate in the same field, develops this same emf E between the axle and the rim. All spokes are connected between the same two po …
- CBSE 2026Set ANNUAL1 markMCQQ.A conducting rod of length l, rotates about one of its ends in a uniform magnetic field B, with a constant angular velocity ω. If the plane of rotation is perpendicular to B, the e.m.f. induced between the ends of rod is ______.(a) (1/2)Bωl²(b) Bωl²(c) 2Bωl²(d) Bωl
›Reveal solutionSolution
A rod rotating about one end sweeps out a circle; summing the motional emf Bvdr over its length gives ε=21Bωl2.
Consider a small element of the rod at distance r from the pivoted end, of length dr. Its linear speed is v=ωr (perpendicular to the rod, in the plane of rotation, hence also perpendicular to B). The motional emf induced across this element is:
dε=Bvdr=Bωrdr
…
- CBSE 2026Set ANNUAL1 markQ.Match the Column A with Column B and write the correct pair. Column A: Motional emf. Column B:(i) μ₀nI,(ii) Volt × second,(iii) μ₀nI/2,(iv) Volt × meter,(v) Volt × meter⁻¹,(vi) Volt.
›Reveal solutionSolution
Motional emf ε = Bvl is a voltage; its unit is volt, option (vi).
When a conductor of length l moves with velocity v perpendicular to a magnetic field B, an emf is induced across it: ε = Bvl. This is an electromotive force, so its …
- CBSE 2025Set ANNUAL1 markMCQQ.A conductor of length 'l' is moving with velocity 'v' parallel to a magnetic field of intensity 'B'. The induced e.m.f. in the conductor will be(a) lvB(b) (1/2) lvB(c) zero(d) (1/2) l^2 vB
›Reveal solutionSolution
Motional EMF in a moving conductor comes from the magnetic force on its free charges, which depends on v x B; if v is parallel to B this cross product vanishes.
The motional EMF induced in a straight conductor of length l moving with velocity v in field B is:
emf = (v x B) . l = B v l sin(phi)
where phi is the angle between v and B. Here the conductor moves parallel to the magnetic field, so phi = 0 degrees, and sin(0) = 0.
emf = B v l sin(0) = 0
…
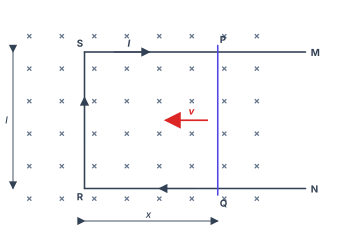
- CBSE 2023Set 55/1/11 markMCQQ.Figure shows a rectangular conductor PSRQ in which the movable arm PQ has resistance r and the resistance of PSRQ is negligible. When PQ is moved with a velocity v, the magnitude of the emf induced does not depend on :(a) magnetic field (B)(b) velocity (v)(c) resistance (r)(d) length of PQ
›Reveal solutionSolution
The induced emf in a moving conductor in a uniform magnetic field is purely a motional emf given by E=Blv, which depends only on the magnetic field B, the length l of the moving arm, and its velocity v. The resistance r of the arm does not appear in this expression — it only determines the current that flows. Hence the correct answer is (c).
The key idea here is the distinction between induced emf and induced current. Many students mix them up, especially when a problem mentions resistance. Let's clear that up first.
When a conductor moves in a magnetic field, the free electrons inside it experience a magnetic Lorentz force q(v×B). This force pushes charges along the conductor, creating a potential difference — that potential difference is the motional emf. It is a direct consequence of the motion and the field, nothing else.
The resistance of the conductor only comes into the picture when you ask: "How much current flows as a result of this emf?" That's Ohm's law: I=E/R. But the emf itself is independent of the resistance.
Now let's walk through the problem step by step.
-
Identify the source of emf. The arm PQ is the only part of the loop that is moving. The rest of the loop (PSRQ) is stationary and has negligible resistance. So the entire induced emf in the loop is generated across PQ.
-
Write the expression for motional emf. For a straight conductor of length l moving with velocity v perpendicular to a uniform magnetic field B, the motional emf is:
E=Blv
This is derived from the work done per unit charge by the magnetic force: Fm=qvB, so the electric field set up inside the conductor is E=vB, and over length l, the potential difference is El=Blv.
- Check each option against this formula.
- (a) magnetic field B — appears in E=Blv. So emf does depend on it.
- (b) velocity v — appears directly. So emf does depend on it.
- (d) length of PQ — that's l in the formula. So emf does depend on it.
- (c) resistance r — does not appear in E=Blv. So emf does not depend on it. …
-
- CBSE 2023Set ANNUAL1 markMCQQ.Direction of current induced in a wire moving in a magnetic field is found using(1) Fleming's left hand rule(2) Fleming's right hand rule(3) Ampere's rule(4) none of these
›Reveal solutionSolution
Fleming's right-hand rule gives the direction of INDUCED current (a motional-EMF/generator situation); the left-hand rule instead gives the direction of FORCE on a current-carrying conductor (a motor situation).
…
- CBSE 2022Set ANNUAL1 markQ.When a metal rod of length l is placed normal to a uniform magnetic field B and moved with a velocity v perpendicular to the field, the induced emf (called motional emf) across its end is ............ .
›Reveal solutionSolution
The induced (motional) emf across the ends of the rod is ε=Bvl.
When a conducting rod of length l moves with velocity v perpendicular to a uniform magnetic field B (with B, v and the rod's length mutually perpendicular), each free charge experiences a magnetic force qvB. This separates charge until an electric field balances it, producin …
- CBSE 2020Set 55/2/11 markQ.A conducting rod of length l is kept parallel to a uniform magnetic field B. It is moved along the magnetic field with a velocity v. What is the value of emf induced in the conductor ?
›Reveal solutionSolution
When a rod moves parallel to a magnetic field, the velocity and field are aligned, so the magnetic flux through any loop remains constant and no emf is induced. The answer is zero.
Why motional emf depends on perpendicular motion
Motional emf arises when a conductor cuts through magnetic field lines. The physical picture: as the rod moves, the magnetic force F=q(v×B) pushes charge carriers along the rod, creating a potential difference. This force—and hence the emf—depends critically on the component of velocity perpendicular to the magnetic field.
The motional emf in a straight rod is given by
E=∫(v×B)⋅dl
For a uniform field and velocity, this simplifies to
E=(v×B)⋅l
where l is the length vector along the rod. The cross product v×B measures how much the velocity is perpendicular to the field. When v and B are parallel (or antiparallel), this cross product vanishes.
Step-by-step analysis
-
Identify the geometry
The rod of length l is parallel to B, and it moves with velocity v along the direction of B. So v∥B.
-
Compute the cross product
Since v and B point in the same (or exactly opposite) direction, the angle θ between them is either 0° or 180°. The magnitude of the cross product is
∣v×B∣=vBsinθ=vB⋅0=0
- Evaluate the motional emf Substituting into the emf formula, …
-
🎓Unlock everything free for 14 days
- ✓Full step-by-step solutions
- ✓Concept-first explanations
- ✓Methods, shortcuts & mistakes
- ✓PYQ mapping + timed mock tests
Full access for 14 days. No credit card required.