Q.Draw the energy level diagram for the hydrogen atom. Show the transitions of the Lyman, Balmer, Paschen, Brackett and Pfund series in the diagram. In which region do these spectra lie? OR What do you understand by electromagnetic induction? State Faraday's laws regarding electromagnetic induction.
🔒You're viewing a preview — the full solution, concept, methods & PYQ mapping are locked.
🔒 Start your 14-day free trial to unlock the full solution →Concept understanding — Bohr Model Energy Levels
The Intuition: Why Can't an Electron Just Sit Anywhere?
Imagine you're rolling a marble on a staircase. The marble can rest on any step — step 1, step 2, step 3 — but it can never float halfway between two steps. The staircase forces the marble into specific, fixed positions.
That's the core idea of the Bohr model. Before Bohr, physicists thought electrons orbited the nucleus like planets around the sun — they could be at any distance, any energy. But experiments showed something strange: atoms only emit or absorb light at very specific colours (wavelengths), not a continuous rainbow. That meant electrons could only have certain, fixed energies — like the steps of a staircase.
Bohr's genius was to say: an electron in an atom cannot have any arbitrary energy. It can only occupy certain "allowed" energy levels. When it jumps from one level to another, it either absorbs or emits a photon of light whose energy exactly matches the difference between those levels.
The Precise Statement
In the Bohr model of the hydrogen atom (and hydrogen-like ions with one electron), the electron moves in circular orbits around the nucleus. But only those orbits are allowed where the electron's angular momentum is an integer multiple of 2πh (where h is Planck's constant).
This quantisation condition leads to a simple formula for the energy of the electron in the n-th orbit:
En=−n213.6 eV
Here:
- n is the principal quantum number — a positive integer (n=1,2,3,…)
- En is the energy of the electron in that level (in electronvolts)
- The negative sign means the electron is bound to the nucleus — you need to add energy to free it
The lowest energy state (n=1) is called the ground state. Its energy is −13.6 eV. The higher states (n=2,3,4,…) are excited states — they have less negative (higher) energies.
As n increases, the energy levels get closer together. At n=∞, the energy becomes 0 eV — the electron is completely free from the atom (ionisation).
What This Explains
When an electron jumps from a higher level (ni) to a lower level (nf), it emits a photon of energy:
ΔE=Enf−Eni=13.6(nf21−ni21) eV
This single formula predicts all the spectral lines of hydrogen — the Lyman series (jumps to n=1), Balmer series (to n=2), Paschen series (to n=3), and so on. Each series corresponds to a different "final step" on the staircase. …
Why this formula?
Why the Bohr Model Gives Those Energy Levels
The Bohr model is a beautiful piece of physics because it takes a simple, almost desperate idea — "electrons only exist in certain orbits" — and derives the entire hydrogen spectrum from it. The key is that Bohr didn't just assume the energy levels; he forced them to be consistent with classical physics in one specific way, then broke with it in another.
The Two Non-Negotiable Pieces
First, the electron moves in a circle around the proton. That's pure classical mechanics: the Coulomb attraction provides the centripetal force.
4πε01r2e2=rmv2
This gives you a relation between speed v and radius r:
v2=4πε0mre2
Second, the total energy of the electron is the sum of its kinetic and potential energies. Potential energy for a Coulomb force is −4πε01re2 (negative because the force is attractive, and we set zero at infinity).
E=21mv2−4πε01re2
Substitute v2 from above:
E=21(4πε0re2)−4πε0re2=−214πε0re2
So far, nothing is quantised. Any radius r gives a valid classical orbit, and the energy just follows from that radius. The problem is that a classical electron in a curved path radiates energy and spirals into the nucleus — atoms should collapse. Bohr needed a rule to pick out stable orbits.
The Quantisation Condition
Bohr's revolutionary step was to postulate that the angular momentum of the electron is quantised in units of ℏ=h/2π:
mvr=nℏ,n=1,2,3,…
Why this particular rule? Bohr later said it was the simplest way to get the right answer. But there's a deeper physical motivation: if you think of the electron as a wave (de Broglie's idea, which came a decade later), the condition that a standing wave fits exactly around the circumference 2πr=nλ gives mvr=nℏ directly. So the quantisation condition is really a wave condition imposed on a particle picture.
The angular momentum quantisation is the only non-classical assumption in the Bohr model. Everything else follows from classical mechanics and electromagnetism.
Deriving the Allowed Radii and Energies
From mvr=nℏ, we get v=nℏ/(mr). Substitute this into the centripetal force equation:
4πε01r2e2=rm(mrnℏ)2=mr3n2ℏ2
Solve for r:
rn=me24πε0ℏ2n2
The constant in front is the Bohr radius a0≈0.529A˚. So the radii are rn=a0n2.
Now plug rn back into the energy expression E=−214πε0re2:
En=−214πε0e2⋅a0n21=−214πε0a0e2⋅n21
Substitute a0=me24πε0ℏ2:
En=−214πε0e2⋅4πε0ℏ2me2⋅n21=−8ε02h2me4⋅n21
En=−n213.6 eV …
The hydrogen energy levels are En=−n213.6 eV. Transitions ending at n=1 give the Lyman series (ultraviolet); ending at n=2 the Balmer series (visible); at n=3 Paschen, at n=4 Brackett, and at n=5 Pfund series (all in the infrared). …
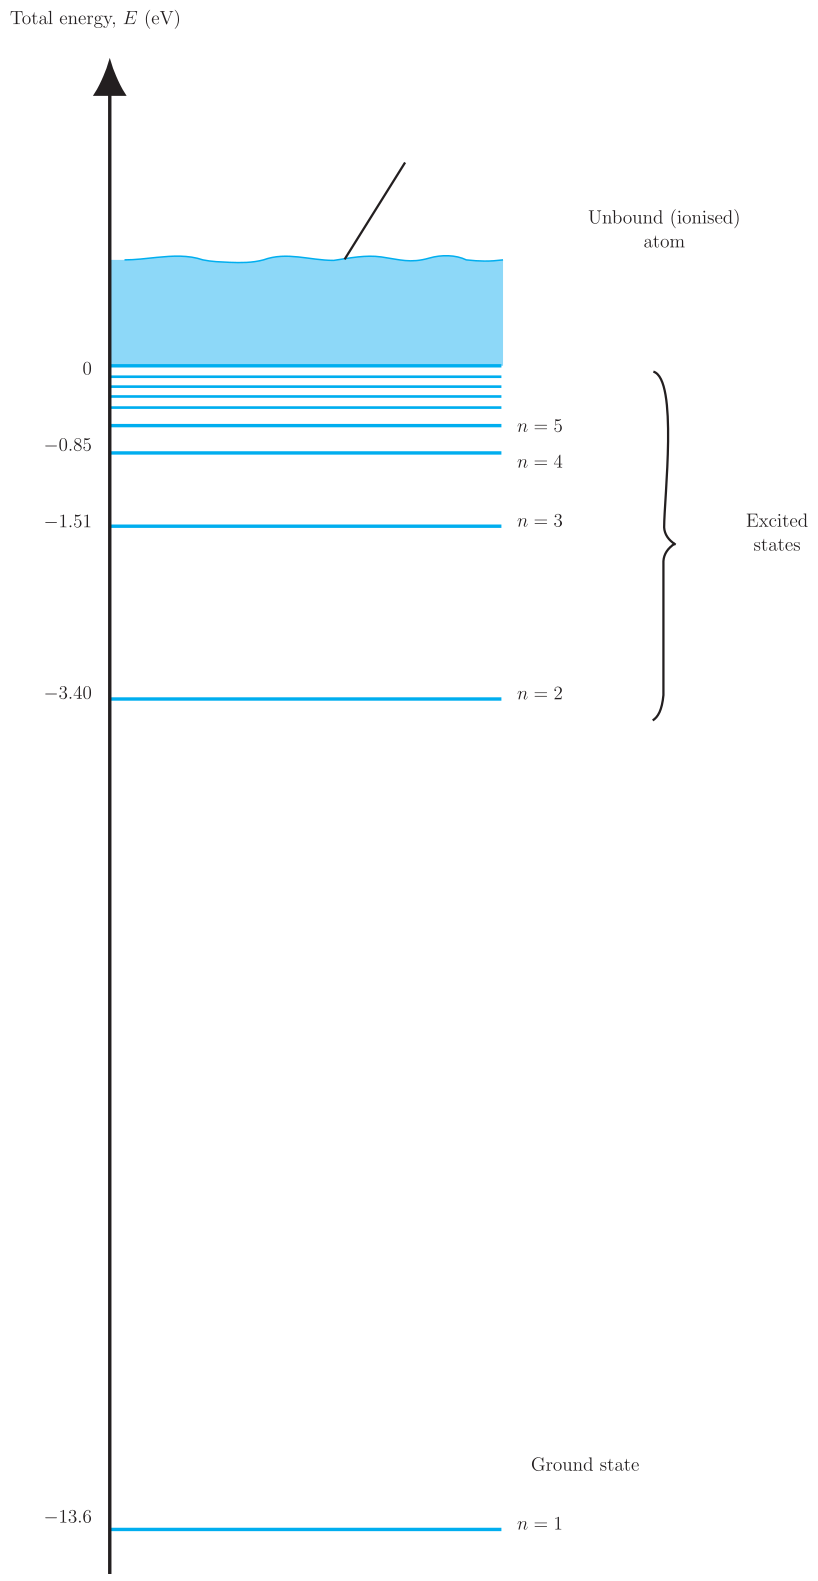
Energy levels En=−13.6/n2 eV; series named by the final level: Lyman→1 (UV), Balmer→2 (visible), Paschen→3, Brackett→4, Pfund→5 (all IR).
Energy-level diagram of hydrogen: The allowed energies are En=−n213.6 eV, so the levels crowd together towards E=0 as n increases:
Spectral series (each is a group of lines from higher levels falling to a common lower level):
- Lyman series — transitions to n=1. Lies in the ultraviolet region.
- Balmer series — transitions to n=2. Lies in the visible region.
- Paschen series — transitions to n=3. Infrared. …
Showing the 12 most recent of 70 on this concept.
- CBSE 2026Set 55/1/11 markMCQQ.For questions 13 to 16, two statements are given – one labelled Assertion (A) and the other labelled Reason (R). Select the correct answer from the codes (A), (B), (C) and (D) below: (A) Both Assertion (A) and Reason (R) are true and Reason (R) is the correct explanation of the Assertion (A). (B) Both Assertion (A) and Reason (R) are true, but Reason (R) is not the correct explanation of the Assertion (A). (C) Assertion (A) is true, but Reason (R) is false. (D) Both Assertion (A) and Reason (R) are false. Assertion (A) : In Bohr model of hydrogen atom, the energy levels are discrete and quantised. Reason (R) : In a hydrogen atom, the electrostatic force on the electron provides the necessary centripetal force to it to revolve around the nucleus.
›Reveal solutionSolution
The key idea is that Bohr’s model indeed has discrete energy levels (true), and the reason given — that electrostatic force provides centripetal force — is also true, but it is a classical condition that does not explain quantisation. So both are true, but the reason is not the correct explanation of the assertion. The answer is (B).
Let’s unpack this carefully. The question is from the Assertion-Reason format, so we need to check two things independently: whether each statement is true, and then whether the reason correctly explains the assertion.
1. Check the Assertion (A):
“In Bohr model of hydrogen atom, the energy levels are discrete and quantised.”
This is absolutely true. Bohr’s model was revolutionary precisely because it introduced quantised orbits — electrons can only occupy certain allowed energy levels, and they jump between these levels by absorbing or emitting photons of specific energies. The energy of the n-th level is given by En=−n213.6 eV, which is clearly discrete. So Assertion (A) is true.
2. Check the Reason (R):
“In a hydrogen atom, the electrostatic force on the electron provides the necessary centripetal force to it to revolve around the nucleus.”
This is also true — it’s a standard Newtonian condition for any circular orbit. For an electron of mass m and speed v at a distance r from the nucleus, the Coulomb attraction r2ke2 equals the centripetal force mv2/r. So Reason (R) is true.
3. Now the crucial part: Does (R) correctly explain (A)?
The reason describes a classical force balance — it’s the same condition that would hold for a planet orbiting the Sun. But that classical condition alone does not lead to discrete, quantised energy levels. In fact, classical physics would allow any orbit radius, and hence any energy. Bohr had to add an extra postulate — quantisation of angular momentum (mvr=nℏ) — to get discrete levels. The electrostatic-centripetal balance is necessary for the model, but it is not the reason for quantisation. So (R) is true but does not explain (A). …
- CBSE 2026Set 55/2/11 markMCQQ.In Bohr model of hydrogen atom, the electron makes a transition from n=5 to n=1 state. As a result, a photon of wavelength λ is emitted. The wavelength of the photon emitted when an electron makes a transition from energy level n=5 to n=2 will be (A) 78λ (B) 724λ (C) 716λ (D) 732λ
›Reveal solutionSolution
The energy difference between levels determines photon wavelength through E=λhc. Since the 5→2 transition releases less energy than 5→1, its photon has a longer wavelength. The answer is 732λ — option (D).
The Bohr model tells us that when an electron drops from a higher energy level to a lower one, it emits a photon whose energy exactly equals the energy difference between those levels. The key relationship is Ephoton=λhc, which shows that energy and wavelength are inversely related: a smaller energy gap produces a longer wavelength.
In hydrogen, the energy of the n-th level is given by:
En=−n213.6 eV
The negative sign indicates that the electron is bound to the nucleus. When the electron transitions from level ni to nf, the energy released is:
ΔE=Eni−Enf=13.6(nf21−ni21) eV
This energy becomes the photon's energy: ΔE=λhc.
For the first transition (5→1):
- Calculate the energy difference:
ΔE1=13.6(121−521)=13.6(1−251)=13.6×2524
- This energy corresponds to wavelength λ:
λhc=13.6×2524
For the second transition (5→2):
- Calculate the energy difference:
ΔE2=13.6(221−521)=13.6(41−251)
- Find a common denominator:
ΔE2=13.6(10025−4)=13.6×10021
- This energy corresponds to wavelength λ′: …
- CBSE 2026Set V11 markMCQQ.Let K be the kinetic energy, U be the potential energy and E be the total energy of an electron revolving around the nucleus in a hydrogen atom, then which of the following is correct?(a) K>0, U>0, E>0(b) K>0, U<0, E<0(c) K>0, U>0, E<0(d) K<0, U<0, E<0
›Reveal solutionSolution
Option (b) K>0, U<0, E<0. …
- CBSE 2026Set ANNUAL1 markMCQQ.Formula for total energy of the electron in the nth stationary state of the hydrogen atom is -(i) −n211.2 eV(ii) +n211.2 eV(iii) −n213.6 eV(iv) +n213.6 eV
›Reveal solutionSolution
Total energy of the electron in the nth Bohr orbit of hydrogen is −13.6/n2 eV.
…
- CBSE 2026Set A1 markMCQQ.The solar spectrum is (A) continuous (B) line spectrum (C) spectrum of black lines (D) spectrum of black bands
›Reveal solutionSolution
The solar spectrum is a line-absorption spectrum: a continuous background crossed by dark (Fraunhofer) lines.
The hot, dense interior of the Sun emits a continuous spectrum. As this light passes through the cooler gases of the Sun's outer atmosphere, atoms there absorb their characteristic wavelengths, leaving dark lines (Fraunhofer lines) superimposed on the …
- CBSE 2026Set A1 markMCQQ.The kinetic energy (K) of an electron in a Bohr orbit is related to its potential energy (U) by (A) K = U (B) K = -U (C) K = -U/2 (D) K = -2U
›Reveal solutionSolution
For an electron in a Bohr orbit, K = -U/2 (with U taken negative), which also gives total energy E = -K.
In a hydrogen-like Bohr orbit the Coulomb attraction provides the centripetal force:
r2ke2=rmv2⇒mv2=rke2.
So the kinetic energy is
K=21mv2=2rke2. …
- CBSE 2026Set ANNUAL1 markQ.Write the definition of emission line spectrum.
›Reveal solutionSolution
When atoms of a rarefied gas are excited (e.g. by heating or an electric discharge) and their electrons fall back to lower energy levels, they emit light only at specific wavelengths, producing a spectrum of separated bright lines rather than a continuous band.
An emission line spectrum is obtained when the light emitted directly by a source of excited atoms (such as a gas discharge tube) is passed through a spectrometer/prism. Because each element's electrons can only occupy discrete (quantised) energy levels, transitions between these levels emit photons of only certain specific energies (and hence specific wavelengths/frequencies). The resulting spectrum consists of a series of bright, sharp coloured lines at these part …
- CBSE 2026Set ANNUAL1 markMCQQ.Case study: Bohr's model addressed the instability of the Rutherford model by introducing quantization. The model is based on three postulates, which successfully explained the discrete line spectrum of hydrogen. According to the model, the radius of the nth stationary orbit is r_n ∝ n², and the total energy is E_n = −13.6 eV / n², when an electron jumps from a higher energy level (E_i) to a lower one (E_f), a photon of energy hν = E_i − E_f is emitted. Transitions ending at the n = 1 level form the Lyman series. The energy of an electron in the first excited state (n = 2) of hydrogen is:(a) –13.6 eV(b) –6.8 eV(c) –3.4 eV(d) –1.7 eV
›Reveal solutionSolution
Bohr energy levels of hydrogen follow En=−13.6/n2 eV; for n=2, E2=−3.4 eV.
En=n2−13.6eV
For the first excited state, n=2: …
- CBSE 2026Set ANNUAL1 markMCQQ.Case study: Bohr's model addressed the instability of the Rutherford model by introducing quantization. The model is based on three postulates, which successfully explained the discrete line spectrum of hydrogen. According to the model, the radius of the nth stationary orbit is r_n ∝ n², and the total energy is E_n = −13.6 eV / n², when an electron jumps from a higher energy level (E_i) to a lower one (E_f), a photon of energy hν = E_i − E_f is emitted. Transitions ending at the n = 1 level form the Lyman series. Transitions ending at n = 3 belong to which series?(a) Lyman series(b) Balmer series(c) Paschen series(d) Brackett series
›Reveal solutionSolution
Transitions of hydrogen electrons ending on the n=3 level constitute the Paschen series (infrared).
…
- CBSE 2026Set ANNUAL1 markQ.Case study: Bohr's model addressed the instability of the Rutherford model by introducing quantization. The model is based on three postulates, which successfully explained the discrete line spectrum of hydrogen. According to the model, the radius of the nth stationary orbit is r_n ∝ n², and the total energy is E_n = −13.6 eV / n², when an electron jumps from a higher energy level (E_i) to a lower one (E_f), a photon of energy hν = E_i − E_f is emitted. Transitions ending at the n = 1 level form the Lyman series. Explain the physical significance of the negative sign in the expression for the total energy E_n of an electron in the Bohr model. OR What is the ratio of the radius of the third Bohr orbit (n = 3) to the radius of the first Bohr orbit (n = 1)?
›Reveal solutionSolution
A negative total energy means the electron is in a bound state — energy must be added to remove it to infinity (where E=0).
The total energy of an electron in the nth Bohr orbit is En=−n213.6eV. The negative sign signifies that the electron is bound to the nucleus by the attractive electrostatic force — its potential energy (taken as zero at infinite separation) is more negative than its kinetic energy is positive, so the net energy is negative. This means external energy (at least ∣En∣) must be supplied …
- CBSE 2026Set ANNUAL1 markMCQQ.In which part of the electromagnetic spectrum, is the Lyman series of hydrogen found?(a) Ultraviolet(b) Scene(c) Infrared(d) X-rays
›Reveal solutionSolution
The Lyman series corresponds to electron transitions from higher levels n=2,3,4,… down to n=1; these are the highest-energy (shortest-wavelength) hydrogen transitions and fall in the ultraviolet.
Using the Rydberg formula λ1=R(121−n21) for n=2,3,4,…, the Lyman series wavelengths work out to roughly 91–122 nm, which lies well below the visible range (about 400–700 nm) and squarely in the ultraviolet band. (By contrast, the Ba …
- CBSE 2026Set ANNUAL1 markMCQQ.The electron in a hydrogen atom makes a transition from an excited state to the ground state. Which of the following statements is true?(a) Its kinetic energy increases and its potential and total energies decrease.(b) Its kinetic energy decreases, potential energy increases and its total energy remains the same.(c) Its kinetic and total energies decrease and its potential energy increases.(d) Its kinetic energy, potential energy and total energy all decrease.
›Reveal solutionSolution
In the Bohr model KE=+2rke2, PE=−rke2=−2KE, and E=KE+PE=−2rke2. As the electron moves to a lower (ground) state, r decreases, so KE increases while PE and E both decrease (become more negative).
Energies in the Bohr model
For an electron in a circular orbit of radius r about the nucleus (charge +e), the Coulomb force supplies the centripetal force:
rmv2=r2ke2 ⟹ mv2=rke2
Kinetic energy:
KE=21mv2=2rke2(always positive)
Potential energy (electrostatic PE between electron and nucleus, taking PE=0 at r=∞):
PE=−rke2(always negative)
Total energy:
E=KE+PE=2rke2−rke2=−2rke2(always negative)
Note that PE=−2KE and E=−KE — standard virial-theorem relations for the Coulomb (inverse-square) force.
Effect of a transition from an excited state to the ground state
Going from an excited state to the ground state means the electron moves to a smaller orbit radius r (ground state, n=1, has the smallest Bohr radius).
…
🎓Unlock everything free for 14 days
- ✓Full step-by-step solutions
- ✓Concept-first explanations
- ✓Methods, shortcuts & mistakes
- ✓PYQ mapping + timed mock tests
Full access for 14 days. No credit card required.