Applied Mathematics · Ch 6 — Probability Distribution
Standard Normal Distribution
Standard Normal Distribution
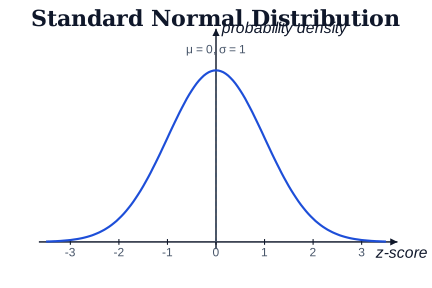
A normal distribution is fully described by just two parameters — its mean and standard deviation . In practice, though, different data sets rarely share the same mean and standard deviation: one set might have a mean of and a standard deviation of , while another has a mean of and a standard deviation of . Comparing values across such differently-scaled normal distributions directly isn't meaningful, since a given value means something different in each. What is needed is a common scale on which any normal variate can b …
Drawn by us to help you understand the concept clearly, and verified to make sure it's accurate. For exams, practice from your NCERT textbook's own diagram.
The standard normal curve has mean 0 and standard deviation 1, with the horizontal axis meas …
Drawn by us to help you understand the concept clearly, and verified to make sure it's accurate. For exams, practice from your NCERT textbook's own diagram.
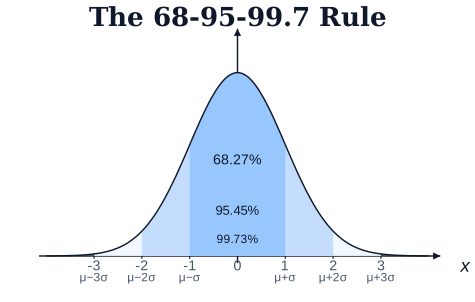
The 68-95-99.7 rule: ~68% of values lie within μ±σ, ~95% within μ±2σ and ~99.7 …