Economics · Ch 10 — The Theory of the Firm under Perfect Competition
Revenue
Revenue
4.2 Revenue
In a perfectly competitive market, a firm can sell any quantity it chooses at the market price. There is no reason to set a price lower than the market price, because the firm can sell as much as it wants at the going rate. So, if the firm decides to sell some output, it sets its price exactly equal to the market price.
Total Revenue
Total revenue (TR) is the total amount a firm earns from selling its output. If the market price of one unit is and the firm sells units, then
Consider a concrete example. Suppose the market for candles is perfectly competitive and the market price of a box of candles is Rs 10. For a candle manufacturer, the relationship between output and total revenue is shown below.
| Boxes sold () | TR (Rs) |
|---|---|
| 0 | 0 |
| 1 | 10 |
| 2 | 20 |
| 3 | 30 |
| 4 | 40 |
| 5 | 50 |
When no box is sold, TR is zero. Selling one box gives TR = 1 × Rs 10 = Rs 10. Two boxes give 2 × Rs 10 = Rs 20, and so on.
The Total Revenue Curve
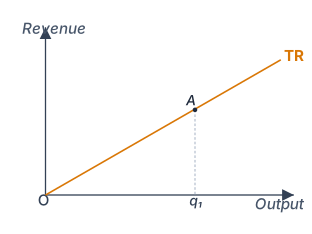
A total revenue curve plots output (quantity sold) on the X-axis and revenue earned on the Y-axis. Three features stand out.
First, when output is zero, total revenue is also zero — so the TR curve passes through the origin (point O).
Second, total revenue rises as output increases. Because the equation is a straight line (price is constant), the TR curve is an upward-sloping straight line.
Third, consider the slope of this line. When output is one unit (horizontal distance in the figure), total revenue (vertical height ) is . Therefore, the slope is
The slope of the total revenue curve equals the market price.
Drawn by us to help you understand the concept clearly, and verified to make sure it's accurate. For exams, practice from your NCERT textbook's own diagram.
In a perfectly competitive market, a single firm is a price taker — it can sell any quantity it wants at the fixed market price . The total revenue (TR) curve in Fig. 4.1 is the simplest possible picture of this idea: it is a straight line through the origin.
The horizontal axis measures the firm’s output level, . The vertical axis measures total revenue, . Because the firm sells each unit at the same price , total revenue is just price times quantity:
Since is a constant, this is a linear equation of the form with slope . So the TR curve is a ray from the origin with a constant slope equal to the market price.
The textbook uses the geometry of this line to make the meaning of “slope” concrete. Pick any point on the TR curve, corresponding to output . Draw a vertical line down from to the horizontal axis — that gives you the point on the output axis. The vertical distance from the origin up to is the total revenue earned at that output, . Now look at the right triangle formed by the origin , the point on the axis, and the point on the curve. The slope of the TR curve is the ratio of the vertical side to the horizontal side:
But is exactly the total revenue , and is the output . So the slope is . The slope of the TR curve at any point is the market price — and because the line is straight, this slope is the same everywhere.
For a price-taking firm, the total revenue curve is a straight line through the origin. Its slope is constant and equals the market price . This slope is also the firm’s marginal revenue and average revenue — all three are equal to under perfect competition.
The physical idea the figure teaches is this: under perfect competition, the firm’s revenue grows in exact proportion to its output. There is no discount for selling more, no premium for selling less — every extra unit adds exactly rupees to total revenue. That is why the line is straight, not curved. If the market price rises, the line becomes steeper; if it falls, the line becomes flatter. But it always remains a ray from the origin because the firm cannot influence the price.
The notation and in the caption uses the convention that a segment named by two points (like ) means the length of that segment. So is the vertical distance from the output axis up to point , and is the horizontal distance from the origin to . …
The TR curve is a straight line through the origin because price is fixed. Every extra unit sold adds exactly the same amount — the market price — to total revenue.
Average Revenue
Average revenue (AR) is total revenue per unit of output. Since ,
For a price-taking firm, average revenue equals the market price.
The Price Line (AR Curve)
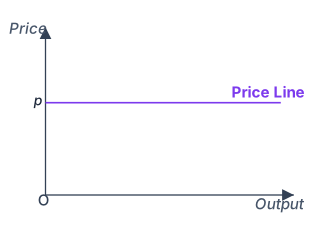
If we plot average revenue (which is the market price) on the Y-axis against different output levels on the X-axis, we get a horizontal straight line that cuts the Y-axis at height . This horizontal line is called the price line. It is also the firm's AR curve under perfect competition.
The price line also represents the demand curve facing the firm. This demand curve is perfectly elastic — the firm can sell as many units as it wants at price , but cannot sell anything at a price above .
Drawn by us to help you understand the concept clearly, and verified to make sure it's accurate. For exams, practice from your NCERT textbook's own diagram.
The figure is a simple two-dimensional graph with the firm’s output (quantity) on the horizontal axis and price (or revenue per unit) on the vertical axis. A single horizontal straight line runs across the entire width of the diagram at a height equal to the market price, . This line is labelled the price line (or sometimes the demand curve facing the firm). The axes are labelled “Output” and “Price”, and the line is marked with the letter at its left end to indicate its vertical intercept.
The physical idea is straightforward: in a perfectly competitive market, the firm is a price taker. It can sell any amount it chooses at the going market price, but it cannot influence that price by changing its own output. So the relationship between the price the firm receives and the quantity it sells is a constant — a flat line. No matter whether the firm produces 10 units or 10,000, each unit fetches exactly the same price . The price line therefore shows that the firm’s demand curve is perfectly elastic (horizontal) at the market price.
Do not confuse this price line with the market demand curve. The market demand curve slopes downward. The price line is the demand curve facing a single firm in perfect competition — it is horizontal because the firm’s output is too small to affect the market price.
The key formula the textbook develops from this figure is the relationship between total revenue and output. Since each unit sells at price , total revenue is:
…
Under perfect competition, the firm's AR curve, its demand curve, and the price line are all the same horizontal line at height .
Marginal Revenue
Marginal revenue (MR) is the increase in total revenue from selling one additional unit of output.
Using the candle example: total revenue from 2 boxes is Rs 20, and from 3 boxes is Rs 30. The change in total revenue is Rs 10, and the change in quantity is 1 box.
This equals the price. Is that a coincidence? No. …