Applied Mathematics · Ch 10 — Descriptive Statistics
Concept Map
Concept Map
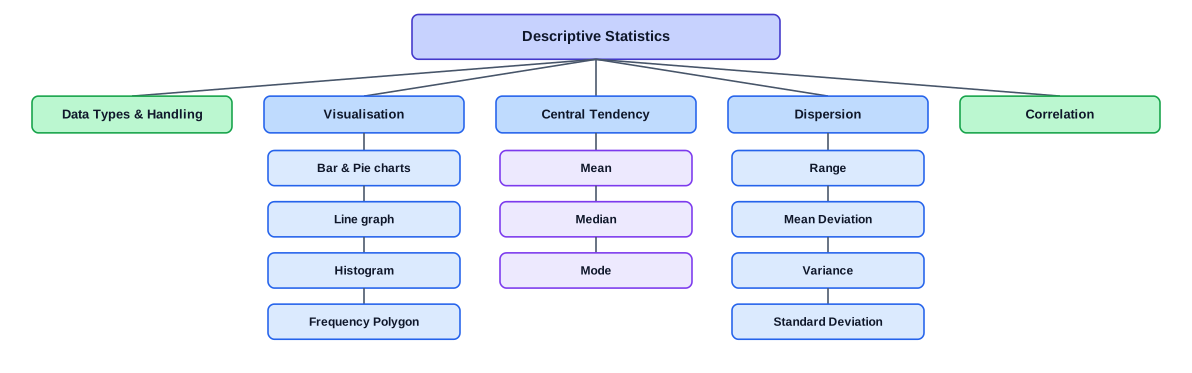
This concept map shows how the chapter fits together. Descriptive statistics summarises data: its types and handling, its visualisation (bar, pie and line charts, histograms and frequency polygons), its central tendency (mean, median, mode), its dispersion (range, mean deviation, variance and standard deviation), measures of position, and the correlation between two variables.
Figure 10.0Concept map of the Descriptive Statistics chapter
Drawn by us to help you understand the concept clearly, and verified to make sure it's accurate. For exams, practice from your NCERT textbook's own diagram.
Concept map of the chapter.