Economics · Ch 6 — Correlation
Introduction
Introduction
In earlier chapters you learnt how to build summary measures — averages and measures of dispersion — out of a mass of data on a single variable. This chapter turns to a different question: how do we examine the relationship between two variables? Many pairs of variables in economics and everyday life seem to move together in a systematic way.
Consider some familiar illustrations:
- As the summer heat rises, hill stations grow more crowded with visitors and ice-cream sales become brisker — so temperature is related to the number of visitors and to ice-cream sales.
- As the supply of tomatoes in the local mandi swells when the harvest reaches the market, the price falls sharply, sometimes from Rs 40 per kg to Rs 4 per kg or even less — so supply is related to price.
Correlation analysis is a means of examining such relationships systematically. It helps answer questions such as:
- Is there any relationship between two variables at all?
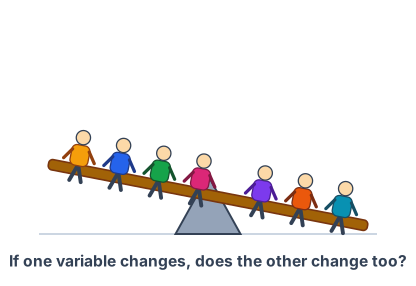
Drawn by us to help you understand the concept clearly, and verified to make sure it's accurate. For exams, practice from your NCERT textbook's own diagram.
Own-drawn illustration (NCERT page 75) of a crowded see-saw tipping under unequal numbers of riders seated on each side -- own-art, not traced.
- If the value of one variable changes, does the value of the other also change?
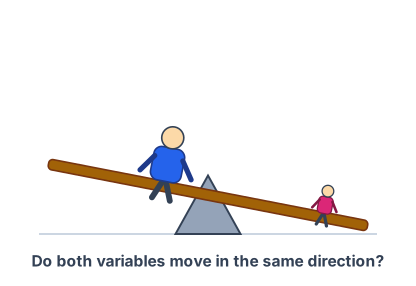
Drawn by us to help you understand the concept clearly, and verified to make sure it's accurate. For exams, practice from your NCERT textbook's own diagram.
Own-drawn illustration (NCERT page 75).
- Do both variables move in the same direction, or in opposite directions?
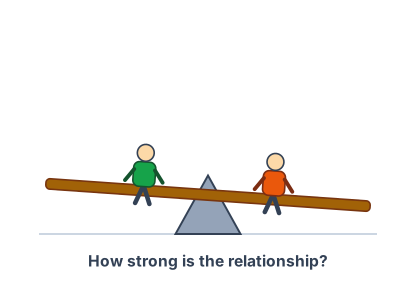
Drawn by us to help you understand the concept clearly, and verified to make sure it's accurate. For exams, practice from your NCERT textbook's own diagram.
Own-drawn illustration (NCERT page 75).
- How strong is the relationship?