Geography · Ch 11 — Land Resources and Agriculture
Land-use Changes in India
Land-use Changes in India
Land-use in any region is largely shaped by the kind of economic activities happening there. But while economic activities change over time, land is fixed in area. So, to understand how land-use shifts, you need to appreciate three broad types of economic changes that put pressure on land.
First, the size of the economy grows over time — due to rising population, changing incomes, and new technology. As the economy expands, pressure on land increases, and even marginal lands (previously unused) get brought into use.
Second, the composition of the economy changes. In developing countries like India, the secondary (industry) and tertiary (services) sectors grow much faster than the primary sector, especially agriculture. This leads to a gradual shift of land from agricultural to non-agricultural uses. You can see this sharp change around large urban areas, where agricultural land is being converted for buildings and infrastructure.
Third, even though agriculture's share in the economy declines, the pressure on agricultural land does not fall. Two reasons: (a) the share of population dependent on agriculture declines much more slowly than agriculture's share in GDP, and (b) the number of people that agriculture must feed keeps rising every day.
Comparing Land-use Changes: 1950–51 to 2019–20
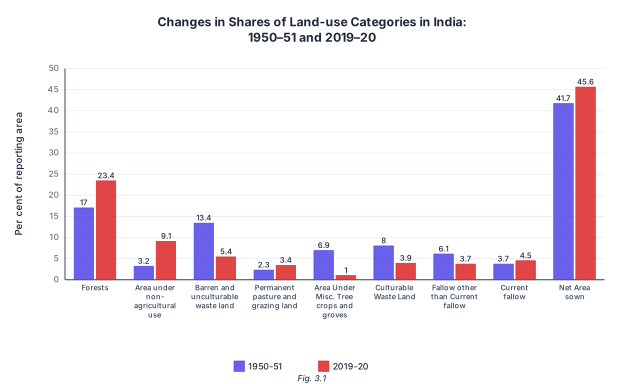
India has undergone major economic changes over the past four to five decades, and these have directly influenced land-use patterns. The textbook provides a figure (Fig. 3.1) comparing shares of different land-use categories between 1950–51 and 2019–20. Two important points to remember when interpreting that figure:
- All percentages are calculated with respect to the reporting area (the total area for which land-use data is available).
- Since the reporting area has remained relatively constant over the years, a decline in one category usually leads to an increase in another.
Five categories registered increases, while four registered declines.
Categories that increased
-
Area under non-agricultural uses — This showed the highest rate of increase. Reason: the changing structure of the Indian economy, with growing contributions from industry and services, plus expansion of related infrastructure. Also, expansion of both urban and rural settlements added to this increase. This area is increasing at the expense of wastelands and agricultural land.
-
Area under forest — The increase here is due to an increase in the demarcated area under forest (i.e., land officially classified as forest), not necessarily an actual increase in forest cover.
-
Permanent pasture and grazing land — Increased, though the textbook does not give a specific reason for this category.
-
Current fallow lands — The increase cannot be explained from just two time points. The trend of current fallow fluctuates a lot from year to year, depending on rainfall variability and cropping cycles.
-
Net area sown — This increase is a recent phenomenon, due to the use of culturable wasteland for agriculture. Before this, net area sown was registering a slow decrease, mostly because of increases in area under non-agricultural use.
The expansion of building activity on agricultural land is visible in both villages and cities — this is a direct example of the shift from agricultural to non-agricultural use.
Categories that declined
-
Barren and wasteland — Declined because pressure on land increased from both agricultural and non-agricultural sectors.
-
Culturable wasteland — Also declined for the same reason: growing pressure from both sectors. …
Drawn by us to help you understand the concept clearly, and verified to make sure it's accurate. For exams, practice from your NCERT textbook's own diagram.
The figure is a grouped vertical bar chart that compares the share of nine land-use categories in India’s total reporting area at two time points: 1950–51 and 2019–20. The y-axis is labelled “Per cent of reporting area” and runs from 0 to 50 in steps of 5, with gridlines at each step. Along the x-axis, nine category groups are arranged. For each category, two bars appear side by side: a light-grey bar for 1950–51 and a dark-grey bar for 2019–20. A legend at the bottom identifies which shade corresponds to which year. The exact value for each bar is printed above it.
The nine categories, with their 1950–51 and 2019–20 percentages, are:
| Land-use category | 1950–51 (%) | 2019–20 (%) |
|---|---|---|
| Forests | 17.0 | 23.4 |
| Area under non-agricultural use | 3.2 | 9.1 |
| Barren and unculturable waste land | 13.4 | 5.4 |
| Permanent pasture and grazing land | 2.3 | 3.4 |
| Area under misc. tree crops and groves | 6.9 | 1.0 |
| Culturable waste land | 8.0 | 3.9 |
| Fallow other than current fallow | 6.1 | 3.7 |
| Current fallow | 3.7 | 4.5 |
| Net area sown | 41.7 | 45.6 |
The chart shows that five categories increased over the 69-year period: forests, area under non-agricultural use, permanent pasture and grazing land, current fallow, and net area sown. Four categories declined: barren and unculturable waste land, culturable waste land, area under tree crops and groves, and fallow other than current fallow.
The most dramatic increase is in area under non-agricultural use, which nearly tripled from 3.2% to 9.1%. This reflects the shift in India’s economy from agriculture toward industry and services, along with the expansion of settlements and infrastructure. The increase in forest area (from 17% to 23.4%) is largely due to reclassification of land as forest rather than actual tree cover growth. The rise in net area sown (from 41.7% to 45.6%) is a recent trend, driven by bringing culturable waste land under the plough. Current fallow fluctuates with rainfall and cropping cycles, so its small increase (3.7% to 4.5%) should not be overinterpreted from just two data points. …