Applied Mathematics · Ch 4 — Integration and Its Application
Consumers' Surplus and Producers' Surplus
Consumers' Surplus and Producers' Surplus
In economics, the demand curve plots the relationship between the price of a good and the quantity demanded at that price, over a given period — conventionally, price is measured on the vertical axis and quantity on the horizontal axis. The law of demand says that as price rises, quantity demanded falls (all else being equal), so the demand curve slopes downward from left to right, following some function .
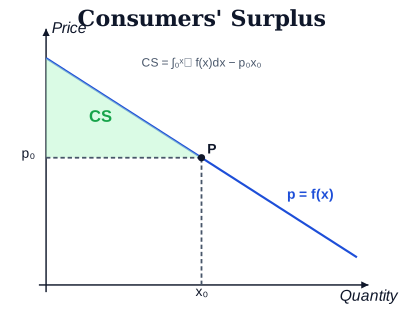
Suppose the good actually sells at the prevailing market price , at which the quantity demanded — read off the demand curve — is . Some buyers in the market would have been willing to pay more than for the good; the fact that they only had to pay leaves them better off. This gain to buyers, taken together, is the consumers' surplus: the additional benefit consumers receive because they end up paying less than the maximum price they were willing to pay. It rises when the market price falls, and falls when the market price rises.
Geometrically, consumers' surplus is the area lying below the demand curve and above the horizontal line , between and — equivalently, the total area under the demand curve up to , minus the rectangular area that buyers actually pay in total:
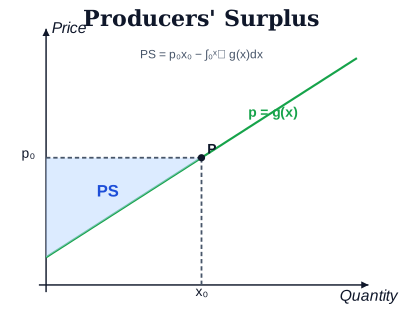
A mirror-image idea applies on the supply side. If is the supply curve and the market again settles at price and quantity , some sellers would have been willing to supply the good at a price lower than ; the fact that they instead receive leaves them better off. This gain to sellers is the producers' surplus — the area above the supply curve and below the line , out to : the rectangle sellers actually receive, minus the area under the supply curve.
Together, consumers' and producers' surplus measure the total gain from trade that a market price creates for buyers and sellers respectively — both are evaluated using exactly the definite-integral techniques developed earlier in this chapter.
Equilibrium Price and Quantity
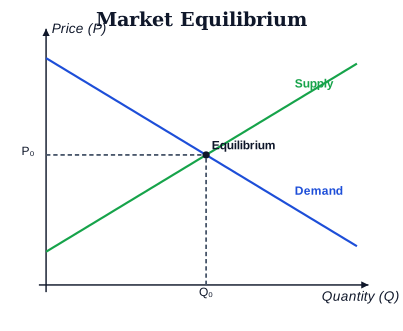
On a graph, the point where the supply curve and the demand curve cross one another is the point of equilibrium. The equilibrium price is the price at which the amount of the product that consumers wish to buy (the quantity demanded) exactly equals the amount producers wish to sell (the quantity supplied); this common, mutually-desired amount is the equilibrium quantity. Surplus problems are almost always evaluated at this point, because and in the consumers'- and producers'-surplus formulae are precisely the equilibrium price and quantity.
To locate it, the book gives a four-step method:
- Solve for the demand function and the supply function in terms of price ().
- Equate (quantity supplied) to (quantity demanded); the resulting equation is in terms of price (). …
Drawn by us to help you understand the concept clearly, and verified to make sure it's accurate. For exams, practice from your NCERT textbook's own diagram.
Consumers' surplus is the area below the demand curve and above the price line p₀ (CS = ∫₀ˣ …
Drawn by us to help you understand the concept clearly, and verified to make sure it's accurate. For exams, practice from your NCERT textbook's own diagram.
Producers' surplus is the area above the supply curve and below the price line p₀ (PS = p₀x …
Drawn by us to help you understand the concept clearly, and verified to make sure it's accurate. For exams, practice from your NCERT textbook's own diagram.
Market equilibrium is where the demand and supply curves intersect, giving the equilibrium price P …