Biology · Ch 4 — Principles of Inheritance and Variation
Inheritance of One Gene
Inheritance of One Gene
Mendel’s first set of experiments looked at the inheritance of a single trait — for example, flower colour, seed shape, or plant height. He chose traits that showed two clear, contrasting forms (like violet vs white flowers, round vs wrinkled seeds, tall vs dwarf plants). By crossing plants that differed in just one such trait, he worked out the basic rules of how a single gene is passed from parent to offspring.
The key idea is that each individual carries two copies (alleles) of a gene for a given trait — one inherited from each parent. If the two alleles are identical, the individual is homozygous for that trait; if they are different, the individual is heterozygous. In a heterozygote, only one of the two alleles (the dominant one) shows up in the appearance (phenotype); the other (the recessive) is hidden but still present in the genetic makeup (genotype).
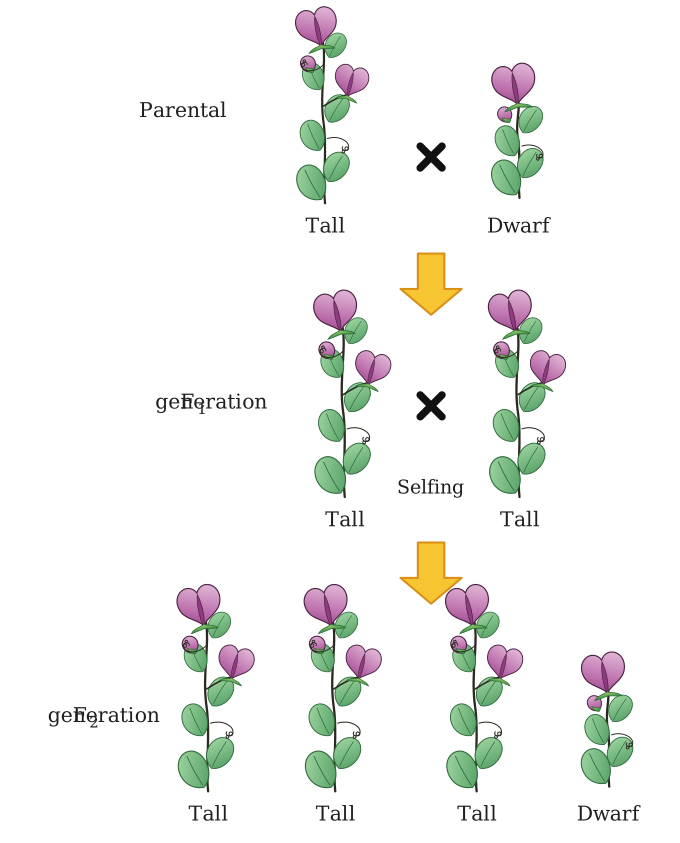
Mendel’s classic cross between a pure-breeding tall pea plant (TT) and a pure-breeding dwarf pea plant (tt) illustrates this. The F₁ generation (first filial generation) were all tall — they all inherited one T from the tall parent and one t from the dwarf parent, making them Tt. The recessive t allele did not disappear; it was simply masked by the dominant T.
When Mendel self-pollinated these F₁ tall plants, the F₂ generation showed a striking pattern: about three-quarters of the plants were tall and one-quarter were dwarf. This 3:1 ratio is the hallmark of monohybrid inheritance. The underlying genotypic ratio was 1 TT : 2 Tt : 1 tt — the homozygous dominant and the heterozygote both looked tall, while only the homozygous recessive looked dwarf.
The 3:1 phenotypic ratio in F₂ arises from the 1:2:1 genotypic ratio because the dominant allele completely masks the recessive one in heterozygotes.
Mendel repeated this experiment with each of the seven contrasting traits he studied, and in every case the F₂ generation gave a 3:1 ratio. This consistency led him to propose the Law of Dominance (in a heterozygote, one allele determines the phenotype) and the Law of Segregation (the two alleles of a gene separate during gamete formation, so each gamete carries only one allele for each trait).
The mechanism behind segregation became clear only later, with the discovery of meiosis. During meiosis I, homologous chromosomes (each carrying one allele) separate into different daughter cells. This physical separation of chromosomes is the cellular basis for the segregation of alleles. A Punnett square is a simple way to predict the outcome of a cross — it shows all possible combinations of gametes and the resulting genotypes and phenotypes.
The Punnett square is a visual tool, not a biological law. It works because gametes combine randomly, and each combination is equally likely. …
Drawn by us to help you understand the concept clearly, and verified to make sure it's accurate. For exams, practice from your NCERT textbook's own diagram.
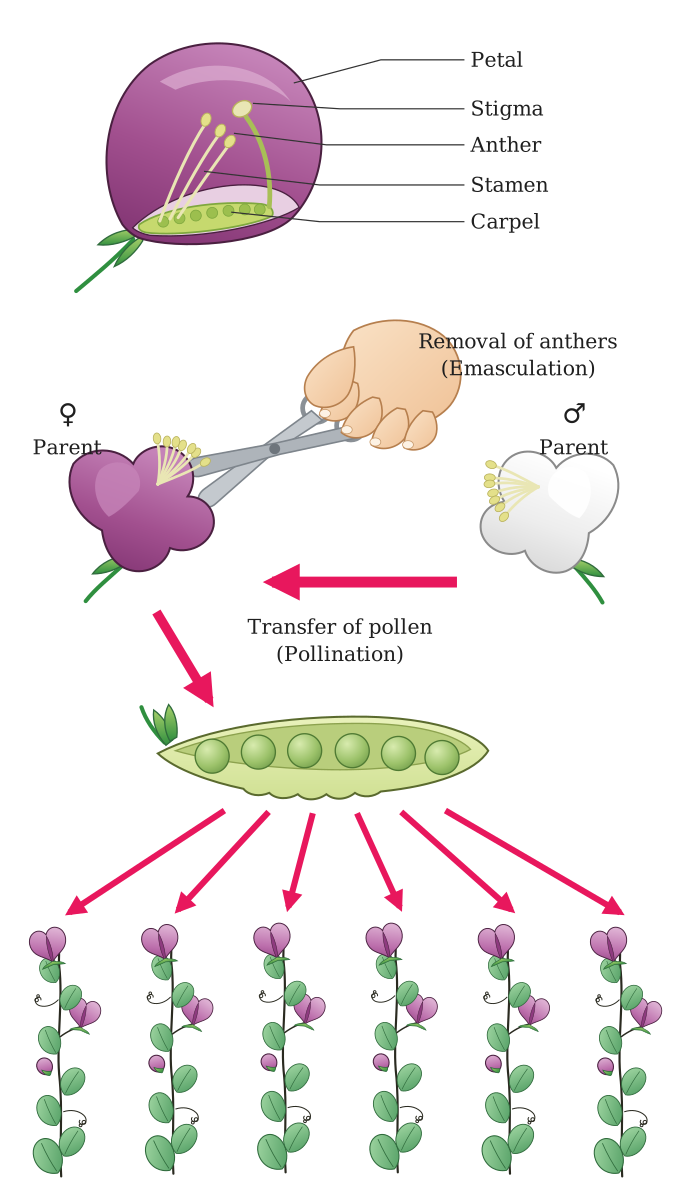
The figure is a step-by-step visual guide to artificial hybridisation in pea plants, the technique Mendel used to create controlled crosses. It is laid out as a sequence of panels, each showing a specific action on a single pea flower.
Panel 1 — Selecting the female parent. A young pea flower bud is shown, still unopened. The key detail is that the anthers inside are immature — they have not yet released pollen. This bud will serve as the female parent, meaning it will receive pollen from a different plant.
Panel 2 — Emasculation. The bud is opened carefully, and the immature anthers are removed with forceps. This step is critical: it prevents self-pollination (which would happen naturally in pea because the flower normally sheds pollen onto its own stigma). By removing the anthers before they dehisce (split open), the flower is made purely female — it can only be fertilised by pollen brought from another flower.
Panel 3 — Bagging. The emasculated flower is immediately covered with a small bag (often made of muslin or paper). The bag is tied around the base of the flower. This protects the stigma from stray pollen carried by wind or insects. The bag stays on until the stigma becomes receptive.
Panel 4 — Pollination. Once the stigma is receptive (a few days later), the bag is removed. Pollen is collected from the mature anthers of the chosen male parent flower. This pollen is dusted onto the stigma of the emasculated female parent flower. The bag is then replaced to keep the cross pure.
Panel 5 — Seed development. The pollinated flower is left to develop into a pod. The seeds inside that pod are the F1 generation — the offspring of the controlled cross. …
Drawn by us to help you understand the concept clearly, and verified to make sure it's accurate. For exams, practice from your NCERT textbook's own diagram.
The figure is laid out as a flow diagram that tracks a single trait — plant height — across three generations. It begins with the parental generation (P) at the top. Two true-breeding pea plants are shown: one tall and one dwarf. The tall parent is labelled TT (homozygous dominant) and the dwarf parent is labelled tt (homozygous recessive). A cross symbol (×) between them indicates a controlled pollination.
An arrow leads downward to the first filial generation (F₁). All offspring in this generation are shown as tall plants, and each is labelled Tt (heterozygous). This panel demonstrates the principle of dominance: the tall allele (T) masks the expression of the dwarf allele (t), so every F₁ plant looks tall despite carrying both alleles.
A second arrow points from the F₁ generation to the second filial generation (F₂). This is produced by self-pollination of the F₁ plants (often indicated by a selfing symbol or a looped arrow). The F₂ panel is divided into two groups: a larger group of tall plants and a smaller group of dwarf plants. The tall plants are labelled with two possible genotypes — TT and Tt — while the dwarf plants are labelled tt. The ratio of tall to dwarf plants is given as 3 : 1, which is the classic monohybrid phenotypic ratio.
The figure also typically includes a Punnett square or a checkerboard alongside the F₂ panel. This square has four boxes, each representing a possible zygote from the fusion of male and female gametes (both T and t). The boxes show the genotypes: one TT, two Tt, and one tt. This layout makes the law of segregation visible: the two alleles of a gene separate during gamete formation, and they recombine randomly at fertilisation. …
Drawn by us to help you understand the concept clearly, and verified to make sure it's accurate. For exams, practice from your NCERT textbook's own diagram.
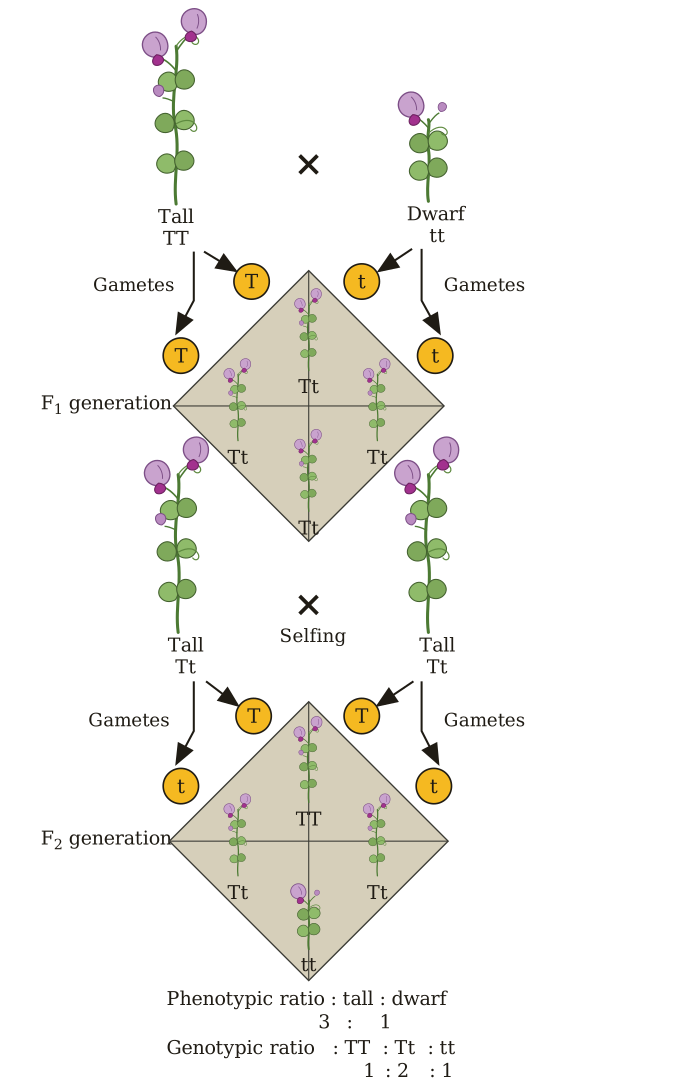
The figure is a standard Punnett square, drawn as a 2×2 grid. Along the top row, outside the grid, are the two possible male gametes from the F1 parent: T and t. Along the left column, outside the grid, are the two possible female gametes from the same F1 parent: T and t. Inside the four cells of the grid, the gametes are combined:
- Top-left cell: T (male) + T (female) → TT
- Top-right cell: t (male) + T (female) → Tt
- Bottom-left cell: T (male) + t (female) → Tt
- Bottom-right cell: t (male) + t (female) → tt
The figure shows no arrows or panels — just the grid, the gamete labels, and the resulting genotypes in each cell. The caption identifies the cross as Mendel’s monohybrid cross between true-breeding tall (TT) and true-breeding dwarf (tt) plants, with the F1 selfed (Tt × Tt).
The Punnett square is a visual tool that predicts the genotypic ratio 1 TT : 2 Tt : 1 tt and the phenotypic ratio 3 tall : 1 dwarf. The key insight: the recessive allele (t) is not lost in the F1 — it is masked by the dominant T, but reappears in the F2 when two t gametes combine. …
Drawn by us to help you understand the concept clearly, and verified to make sure it's accurate. For exams, practice from your NCERT textbook's own diagram.
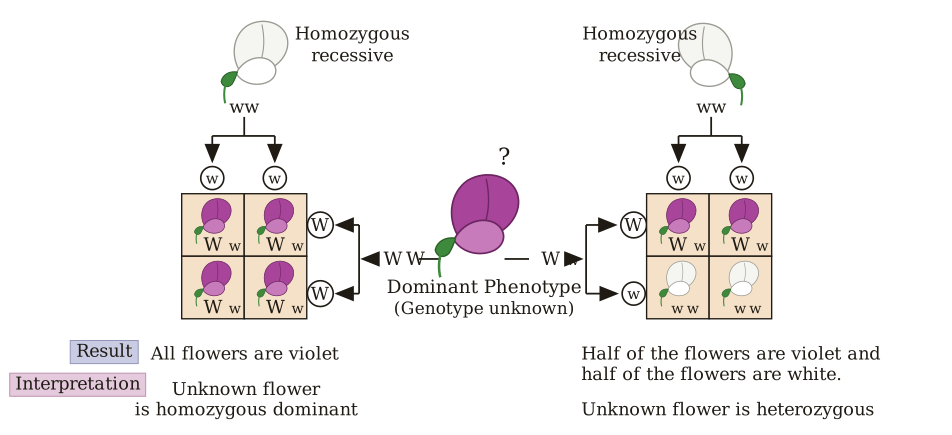
The figure shows a single test-cross flower of unknown genotype (dominant, violet-flowered phenotype, marked with a ?) crossed separately against a homozygous recessive white-flowered tester (ww) on each side, to reveal whether the unknown plant is WW or Ww.
Left branch — if the unknown is WW.
The homozygous-recessive tester (ww) produces only w gametes; the unknown WW parent produces only W gametes. Every cross in the Punnett square gives Ww, so all four offspring are violet.
Result: All flowers are violet.
Interpretation: the unknown flower is homozygous dominant.
Right branch — if the unknown is Ww.
The tester again contributes only w gametes, but the unknown Ww parent contributes both W and w gametes in equal proportion. The Punnett square gives two Ww and two ww offspring.
Result: Half the flowers are violet and half are white.
Interpretation: the unknown flower is heterozygous.
What the figure teaches. …