Chemistry · Ch 4 — The d- and f-Block Elements
Trends in the M²⁺/M Standard Electrode Potentials
Trends in the M²⁺/M Standard Electrode Potentials
The M²⁺/M reduction process
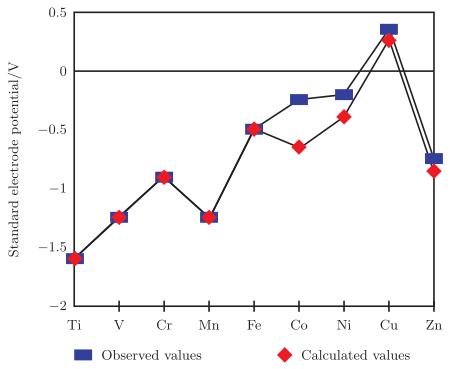
Forming a divalent metal ion M²⁺(aq) from the solid metal can be broken down into a chain of thermochemical steps: atomisation of the solid into gaseous atoms, successive removal of two electrons (the first and second ionisation), and hydration of the resulting gaseous ion. The measured standard electrode potential for the M²⁺/M couple is essentially the net energy balance of this whole sequence — the enthalpy of atomisation, the sum of the first two ionisation enthalpies, and the strongly exothermic hydration enthalpy of M²⁺ acting together. Because an rebuilt purely from these thermochemical quantities matches the experimentally observed values closely across the row from Ti to Zn, the electrode potential of a 3d metal can be understood almost entirely as a consequence of these three energy terms.
The general trend across the series
Moving from Ti to Zn, the (M²⁺/M) values become steadily less negative. This shift runs parallel to the general rise in the combined first and second ionisation enthalpies across the row: as a metal atom becomes progressively harder to strip of two electrons, less energy is recovered on the reduction step, and the electrode potential is pulled toward less negative — and, in one case, positive — values.
Copper — the exception to the trend
Copper stands apart from every other first-row metal in having a positive (M²⁺/M). This single fact explains why copper cannot displace hydrogen from dilute acids the way most other metals of the series can — only oxidising acids, such as nitric acid or hot concentrated sulphuric acid, attack copper metal, and even then it is the acid itself that undergoes reduction, not H⁺. The underlying reason is energetic: the enthalpy required to convert solid copper into gaseous Cu²⁺ is unusually high, and copper's hydration enthalpy is not large enough to compensate for it — leaving the overall process for Cu(s) → Cu²⁺(aq) endothermic on balance.
Drawn by us to help you understand the concept clearly, and verified to make sure it's accurate. For exams, practice from your NCERT textbook's own diagram.
The figure plots standard electrode potentials ( for ) against the elements from titanium (Ti) to zinc (Zn) in the first transition series. The x-axis lists the elements in order of increasing atomic number: Ti, V, Cr, Mn, Fe, Co, Ni, Cu, Zn. The y-axis shows in volts, ranging from approximately −2.0 V to +0.5 V.
Two curves are drawn on the same axes:
- Observed values (marked with squares): the actual measured for each metal.
- Calculated values (marked with diamonds): the predicted from a simple thermochemical cycle using only the sum of the first two ionisation enthalpies (), the enthalpy of atomisation (), and the hydration enthalpy of ().
Both curves rise together irregularly from Ti toward a positive peak at Cu, then drop sharply at Zn. They track each other closely, but there are notable bumps — deviations where the observed value is more negative than the calculated trend — at Mn and Zn. The text explains that the general upward trend (from negative to less negative, then positive) is due to the increase in the sum of the first and second ionisation enthalpies across the series. The extra stability of the half-filled subshell in and the completely filled subshell in makes these ions harder to reduce, shifting their to more negative values than the simple calculation predicts. For Ni, the more negative observed value is linked to its highly negative hydration enthalpy ().
The key formula the textbook develops with this figure is the thermochemical cycle that relates to the enthalpy changes:
where:
- = enthalpy of atomisation of the metal (kJ mol⁻¹)
- = first ionisation enthalpy (kJ mol⁻¹)
- = second ionisation enthalpy (kJ mol⁻¹)
- = hydration enthalpy of the ion (kJ mol⁻¹)
- = Faraday constant (96 485 C mol⁻¹) …
Departures from the smooth trend: Mn, Ni and Zn
Although the trend across the series is broadly smooth, three metals show values noticeably more negative than the general trend would predict.
Manganese's deviation traces to the special stability of the half-filled configuration of Mn²⁺, and zinc's deviation traces to the fully filled configuration of Zn²⁺ — in both cases, the ion sits in an especially settled electronic arrangement that the smooth trend line does not otherwise account for. …
| Element (M) | (M) | /V | |||
|---|---|---|---|---|---|
| Ti | 469 | 656 | 1309 | −1866 | −1.63 |
| V | 515 | 650 | 1414 | −1895 | −1.18 |
| Cr | 398 | 653 | 1592 | −1925 | −0.90 |
| Mn | 279 | 717 | 1509 | −1862 | −1.18 |
| Fe | 418 | 762 | 1561 | −1998 | −0.44 |
| Co | 427 | 758 | 1644 | −2079 | −0.28 |
| Ni | 431 | 736 | 1752 | −2121 | −0.25 |
| Cu | 339 | 745 | 1958 | −2121 | 0.34 |
| Zn | 130 | 906 | 1734 | −2059 | −0.76 |