Physics · Ch 7 — Alternating Current
Phasor-diagram Solution
Phasor-diagram Solution
Why Phasors?
In a series LCR circuit, the current through the resistor, inductor, and capacitor is the same at every instant. However, the voltages across each element are not in phase with each other or with the current. Adding these voltages directly (as numbers) is wrong because they peak at different times. Phasors solve this by representing each alternating quantity as a rotating arrow; the vertical projection of the phasor gives the instantaneous value. Adding phasors is vector addition, which correctly accounts for phase differences.
Step 1: Represent the Current and Voltages as Phasors
Let the circuit current be:
where is the phase angle between the source voltage and the current .
Define the phasors:
- — phasor representing the current .
- — phasor for voltage across resistor .
- — phasor for voltage across inductor .
- — phasor for voltage across capacitor .
- — phasor for the source voltage.
From earlier sections, the phase relations are:
- is parallel to (voltage and current in phase for a resistor).
- is ahead of (voltage leads current by for an inductor).
- is behind (voltage lags current by for a capacitor).
The amplitudes (peak values) are:
where and .
Step 2: The Voltage Phasor Equation
Kirchhoff’s voltage law for the series circuit (instantaneous values) is:
In phasor form, this becomes a vector sum:
Step 3: Combine and
Since and lie along the same line but point in opposite directions (one is , the other relative to ), they can be combined into a single phasor:
The phasor diagram now becomes a right triangle:
- Horizontal side: (parallel to )
- Vertical side: (perpendicular to )
- Hypotenuse: (source voltage)
Step 4: Derive the Impedance
Using the Pythagorean theorem on the right triangle:
Substitute the amplitudes from Step 1:
Factor :
Take square roots (positive amplitudes):
Thus the peak current is:
By analogy with Ohm’s law, define the impedance of the series LCR circuit:
so that:
has units of ohms () and represents the total opposition to current in the AC circuit.
Step 5: Find the Phase Angle
From the same right triangle, the phase angle (angle between and , hence between and ) satisfies: …
Drawn by us to help you understand the concept clearly, and verified to make sure it's accurate. For exams, practice from your NCERT textbook's own diagram.
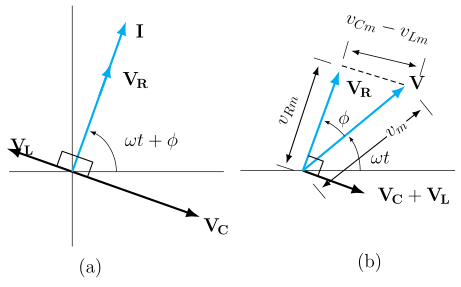
Figure 7.11 has two panels that together show how the individual phasor voltages in a series LCR circuit add up to the source voltage.
Panel (a) shows the four phasors — current , resistor voltage , inductor voltage , and capacitor voltage — drawn on a set of – axes. The key phase relationships are:
- and are parallel (pointing up and to the right), because the voltage across a resistor is in phase with the current.
- points up and to the left, leading by (90°).
- points straight down, lagging by (90°), exactly opposite to .
- A small right-angle square at the origin marks the axes.
This panel establishes the relative directions of the phasors before any addition is done.
Panel (b) shows the vector addition that leads to the source voltage . The phasor is drawn along the current direction. The two reactive phasors and are combined into a single phasor ; because they point in opposite directions, the resultant is a shorter phasor pointing down and to the right (the direction of the larger of the two). The resultant of and is the source phasor , which forms the hypotenuse of a right triangle. The phase angle is marked between and . The dashed top segment is labelled , the horizontal side is , and the hypotenuse is .
Physical idea: In a series LCR circuit, the same current flows through all three elements, but the voltages across them are not in phase. The resistor voltage is in phase with the current, the inductor voltage leads by 90°, and the capacitor voltage lags by 90°. Because and are exactly opposite, they partially cancel. The net voltage across the reactive part is , and the total source voltage is the vector sum of and this net reactive voltage.
Key formulas developed from this figure:
The Pythagorean theorem applied to the right triangle in panel (b) gives the amplitude of the source voltage:
Substituting , , and (from Eq. 7.22) yields:
This leads to the definition of impedance :
so that (Eq. 7.25b). …
Drawn by us to help you understand the concept clearly, and verified to make sure it's accurate. For exams, practice from your NCERT textbook's own diagram.
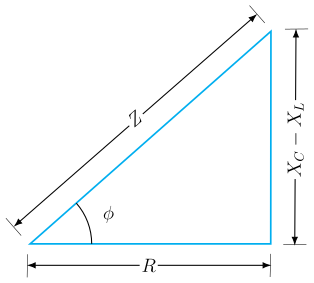
The impedance diagram (Fig. 7.12) is a right-angled triangle that summarises the relationship between resistance, reactance, and impedance in a series LCR circuit. It is not a phasor diagram (which shows time-varying voltages and currents), but a static geometric representation of the magnitudes of the circuit's opposition to alternating current.
- The horizontal base is labelled — the resistance (in ohms). This side is drawn along the real axis.
- The vertical side (right side of the triangle) is labelled — the net reactance. This is the difference between capacitive reactance and inductive reactance . The vertical direction represents the imaginary axis.
- The hypotenuse is labelled — the impedance (in ohms). It runs from the bottom-left origin to the top-right vertex.
- A small right-angle square is drawn at the bottom-right vertex, confirming the triangle is right-angled.
- The angle is marked at the bottom-left vertex, between the base and the hypotenuse . This angle is the phase difference between the source voltage and the circuit current.
Physical idea: The diagram teaches that impedance is the vector sum of resistance (along the real axis) and net reactance (along the imaginary axis). The Pythagorean theorem gives the magnitude of , and the angle gives the phase relationship.
Key formulas developed from this figure:
where:
- = impedance of the series LCR circuit (Ω)
- = resistance (Ω)
- = capacitive reactance (Ω)
- = inductive reactance (Ω)
…
Drawn by us to help you understand the concept clearly, and verified to make sure it's accurate. For exams, practice from your NCERT textbook's own diagram.
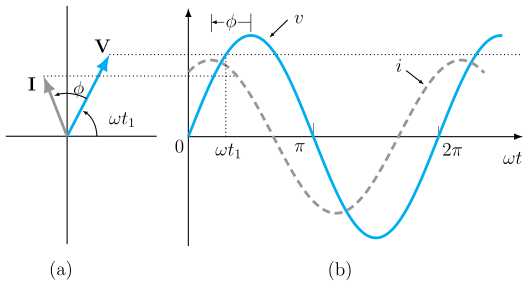
What Figure 7.13 Shows
The figure has two panels, both for the case — meaning the capacitive reactance dominates over inductive reactance, so the circuit behaves as predominantly capacitive.
Panel (a): Phasor diagram
- A phasor I (current) is drawn at some angle.
- A phasor V (source voltage) is drawn at a smaller angle — specifically, V points up-and-right at angle .
- Since , the current leads the voltage: the I phasor is drawn ahead (higher angle) than V.
- The phase angle is marked between V and I, showing how much the current leads the voltage.
- The phasors rotate anticlockwise with angular frequency ; at the instant , their positions are frozen.
Panel (b): Graphs of and versus
- Horizontal axis: (angular time), with ticks at , , , .
- Vertical axis: instantaneous voltage (solid curve) and current (dashed curve).
- The current curve leads the voltage curve: the dashed peak occurs before the solid peak by a horizontal offset equal to the phase angle .
- This offset is marked near the peaks, showing that reaches its maximum earlier than .
Physical Idea
The figure visually demonstrates that in a series LCR circuit, when , the net reactance is capacitive, so the current leads the source voltage by a phase angle . The phasor diagram shows the steady-state relationship between the phasors, while the time graphs show how this phase difference appears in the actual sinusoidal waveforms.
Key Formulas Developed with This Figure
From the textbook analysis using the phasor diagram (Fig. 7.11 and 7.12), the following results are obtained:
Impedance
where is resistance, is capacitive reactance, and is inductive reactance. …