Physics · Ch 8 — Electromagnetic Waves
Electromagnetic Spectrum
Electromagnetic Spectrum
The Electromagnetic Spectrum: A Continuum of Waves
The electromagnetic spectrum is the complete classification of all electromagnetic (EM) waves arranged by their frequency (or wavelength). At the time of Maxwell, only visible light was well-known. Today, we know the spectrum includes radio waves, microwaves, infrared, visible light, ultraviolet, X-rays, and gamma rays.
Key idea: There are no sharp boundaries between different types of EM waves. The classification is based roughly on how they are produced and detected.
Ordering the Spectrum
The spectrum is typically presented in order of decreasing wavelength (or increasing frequency):
- Radio waves (longest wavelength)
- Microwaves
- Infrared (IR)
- Visible light (the tiny portion we can see)
- Ultraviolet (UV)
- X-rays
- Gamma rays (shortest wavelength)
All these waves travel at the same speed in vacuum: the speed of light, .
The Fundamental Relation
For any electromagnetic wave, the relationship between its speed (), frequency (), and wavelength () is:
- = speed of light in vacuum () …
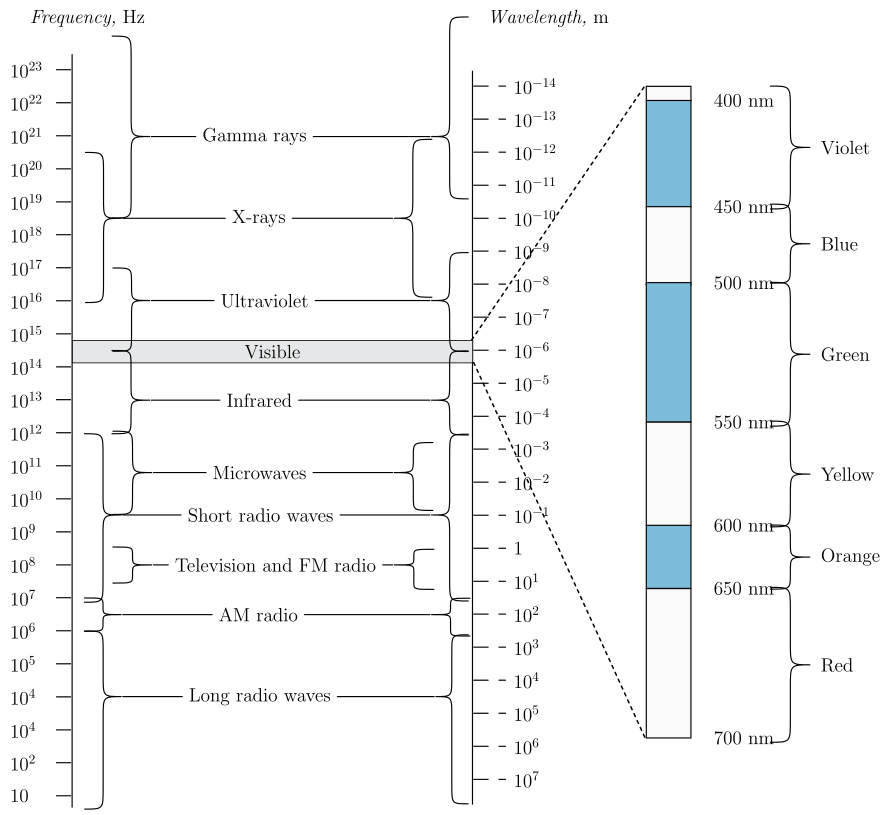
Drawn by us to help you understand the concept clearly, and verified to make sure it's accurate. For exams, practice from your NCERT textbook's own diagram.
The figure is a two-scale vertical chart that maps the entire range of electromagnetic radiation by frequency and wavelength. The left vertical axis shows frequency in hertz (Hz), increasing from Hz at the bottom to Hz at the top, with each tick mark representing a power of ten (decade). The right vertical axis shows wavelength in metres (m), decreasing from m at the bottom to m at the top. The two axes are parallel and inversely related: as frequency increases upward, wavelength decreases upward.
Between the axes, brace-bracketed bands label the major regions of the electromagnetic spectrum from top to bottom: Gamma rays, X-rays, Ultraviolet, a highlighted Visible strip (around Hz), Infrared, Microwaves, Short radio waves, Television and FM radio, AM radio, and Long radio waves. A dotted call-out fans from the Visible strip to a magnified vertical colour bar on the far right, marked 400 nm to 700 nm, with braces naming Violet, Blue, Green, Yellow, Orange, Red in order of decreasing wavelength (or increasing frequency).
Physical idea taught
The figure teaches that electromagnetic waves form a continuous spectrum with no sharp boundaries between regions. The classification is based on how waves are produced or detected, not on fundamental physical differences. All regions obey the same wave equation, but their vastly different frequencies and wavelengths lead to different practical uses and interactions with matter.
Key formula developed with this figure
The fundamental relation connecting frequency () and wavelength () for all electromagnetic waves in vacuum is:
where:
- = speed of light in vacuum ( m/s)
- = frequency (Hz) …