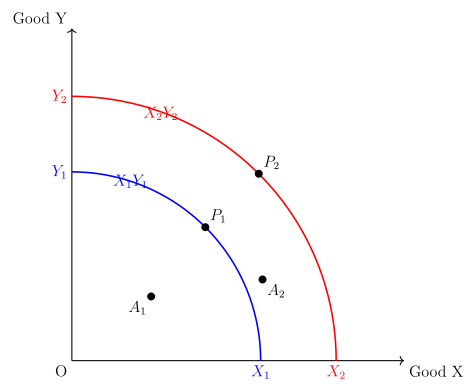
Q.In the given figure X1Y1 and X2Y2 are Production Possibility Curves in two different periods T1 and T2 respectively for Good X and Good Y. A1 and A2 represent actual outputs and P1 and P2 represent potential outputs respectively in the two time periods. The change in actual output of Goods X and Y over the two periods would be represented by movement from _________ . (Fill up the blank)
🔒You're viewing a preview — the full solution, concept, methods & PYQ mapping are locked.
🔒 Start your 14-day free trial to unlock the full solution →Part (a)Concept understanding — Production Possibility Frontier
Imagine you have only 4 hours to study after school. You can spend them all on Physics, all on Economics, or split them between the two. If you study only Physics, you might master 4 chapters. If only Economics, you could finish 6 chapters. But if you split your time, you get some of both — maybe 3 Physics chapters and 3 Economics chapters.
That trade-off is the core idea behind the Production Possibility Frontier (PPF).
What the PPF actually is
The PPF is a curve that shows all the maximum combinations of two goods (or services) an economy can produce when it uses all its resources fully and efficiently, given the current technology.
Think of a country that produces only two things: wheat and cloth. It has a fixed amount of land, labour, and machines. If it puts everything into wheat, it gets, say, 100 tonnes of wheat and zero cloth. If it puts everything into cloth, it gets 50 metres of cloth and zero wheat. In between, there are many possible combinations — 80 tonnes of wheat and 20 metres of cloth, or 50 tonnes of wheat and 35 metres of cloth, and so on.
Plot these points on a graph: wheat on the x-axis, cloth on the y-axis. The curve that connects them is the PPF.
The PPF is always drawn as a downward-sloping curve that is concave to the origin (bowed outward). The downward slope is obvious — to get more of one good, you must give up some of the other. The outward bow shape comes from the law of increasing opportunity cost, which we'll see in a moment.
The key ideas the PPF teaches
1. Scarcity and choice
The PPF is a picture of scarcity. You cannot have everything — the economy cannot produce a point outside the curve (like 100 tonnes of wheat and 50 metres of cloth) because resources are limited. Every point on the curve is efficient; every point inside the curve (like 40 tonnes of wheat and 10 metres of cloth) means resources are lying idle or being used wastefully.
2. Opportunity cost
Moving from one point on the PPF to another means producing more of one good and less of the other. The amount of the good you give up is the opportunity cost of getting more of the other good.
Here's where the shape matters. Because resources are not equally suited to producing both goods, the opportunity cost increases as you produce more of one good. Early on, you shift land that is great for wheat into cloth production — you lose only a little wheat for a lot of cloth. But as you keep shifting, you start pulling land that is excellent for wheat but terrible for cloth. Now you lose a lot of wheat for just a little extra cloth. This is the law of increasing opportunity cost, and it is why the PPF is bowed outward (concave to the origin).
Marginal Opportunity Cost (MOC) = Units of good gainedUnits of good given up
For example, if moving from combination A to B means losing 10 tonnes of wheat to gain 5 metres of cloth, the MOC of 1 metre of cloth is 510=2 tonnes of wheat.
3. Efficiency and inefficiency
- Points on the PPF: The economy is using all resources fully and efficiently. You cannot produce more of one good without producing less of the other.
- Points inside the PPF: Resources are underutilised — maybe there is unemployment, or factories are running below capacity. You can produce more of both goods without sacrificing anything.
- Points outside the PPF: Unattainable with current resources and technology.
4. Economic growth
If the economy gets more resources (more labour, more capital) or better technology, the entire PPF shifts outward. Now combinations that were previously impossible become possible. This is what we call economic growth.
Why the PPF matters (NCERT's emphasis)
The NCERT textbook uses the PPF to introduce three fundamental economic problems:
- What to produce? — Which point on the PPF should we choose?
- How to produce? — Which production method (labour-intensive or capital-intensive) keeps us on the PPF? …
Part (b)Concept understanding — Production Possibility Frontier
Imagine you have only 4 hours to study after school. You can spend them all on Physics, all on Economics, or split them between the two. If you study only Physics, you might master 4 chapters. If only Economics, you could finish 6 chapters. But if you split your time, you get some of both — maybe 3 Physics chapters and 3 Economics chapters.
That trade-off is the core idea behind the Production Possibility Frontier (PPF).
What the PPF actually is
The PPF is a curve that shows all the maximum combinations of two goods (or services) an economy can produce when it uses all its resources fully and efficiently, given the current technology.
Think of a country that produces only two things: wheat and cloth. It has a fixed amount of land, labour, and machines. If it puts everything into wheat, it gets, say, 100 tonnes of wheat and zero cloth. If it puts everything into cloth, it gets 50 metres of cloth and zero wheat. In between, there are many possible combinations — 80 tonnes of wheat and 20 metres of cloth, or 50 tonnes of wheat and 35 metres of cloth, and so on.
Plot these points on a graph: wheat on the x-axis, cloth on the y-axis. The curve that connects them is the PPF.
The PPF is always drawn as a downward-sloping curve that is concave to the origin (bowed outward). The downward slope is obvious — to get more of one good, you must give up some of the other. The outward bow shape comes from the law of increasing opportunity cost, which we'll see in a moment.
The key ideas the PPF teaches
1. Scarcity and choice
The PPF is a picture of scarcity. You cannot have everything — the economy cannot produce a point outside the curve (like 100 tonnes of wheat and 50 metres of cloth) because resources are limited. Every point on the curve is efficient; every point inside the curve (like 40 tonnes of wheat and 10 metres of cloth) means resources are lying idle or being used wastefully.
2. Opportunity cost
Moving from one point on the PPF to another means producing more of one good and less of the other. The amount of the good you give up is the opportunity cost of getting more of the other good.
Here's where the shape matters. Because resources are not equally suited to producing both goods, the opportunity cost increases as you produce more of one good. Early on, you shift land that is great for wheat into cloth production — you lose only a little wheat for a lot of cloth. But as you keep shifting, you start pulling land that is excellent for wheat but terrible for cloth. Now you lose a lot of wheat for just a little extra cloth. This is the law of increasing opportunity cost, and it is why the PPF is bowed outward (concave to the origin).
Marginal Opportunity Cost (MOC) = Units of good gainedUnits of good given up
For example, if moving from combination A to B means losing 10 tonnes of wheat to gain 5 metres of cloth, the MOC of 1 metre of cloth is 510=2 tonnes of wheat.
3. Efficiency and inefficiency
- Points on the PPF: The economy is using all resources fully and efficiently. You cannot produce more of one good without producing less of the other.
- Points inside the PPF: Resources are underutilised — maybe there is unemployment, or factories are running below capacity. You can produce more of both goods without sacrificing anything.
- Points outside the PPF: Unattainable with current resources and technology.
4. Economic growth
If the economy gets more resources (more labour, more capital) or better technology, the entire PPF shifts outward. Now combinations that were previously impossible become possible. This is what we call economic growth.
Why the PPF matters (NCERT's emphasis)
The NCERT textbook uses the PPF to introduce three fundamental economic problems:
- What to produce? — Which point on the PPF should we choose?
- How to produce? — Which production method (labour-intensive or capital-intensive) keeps us on the PPF? …
Part (a)
The Production Possibility Curve shows potential (maximum) output when resources are fully and efficiently used; actual output is what is really produced and may lie on or inside the curve. Here A1 and A2 are the actual outputs in periods T1 and T2. The change in actual output over the two periods is therefore the movement from A1 to A2 — option (d). …
Part (a): Actual output changes from A1 to A2 — option (d).
Part (b): A constant MRT gives a straight-line PPC.
Part (a)
A Production Possibility Curve (PPC) shows the maximum combinations of two goods an economy can produce with given resources and technology. Points on the curve represent potential output (full, efficient use of resources); points inside it represent actual output when resources are under-utilised or used inefficiently. …
- CGBSE Chhattisgarh Higher Secondary Class 12 (Commerce) 2026Set ANNUAL4 marksQ.What do you understand by production possibility curve? In what situation the curve will shift towards right?
›Reveal solutionSolution
The PPC shows the maximum output combinations of two goods; it shifts right when resources grow or technology improves.
Meaning — The production possibility curve (also called the production possibility frontier or transformation curve) shows the various maximum combinations of two goods that an economy can produce when it uses all its given resources fully and efficiently with the available technology. It is concave to the origin because of increasing opportunity cost, and any point on it represents full and efficient use of resources.
When does it shift to the right (outward)? The PPC shifts outward (right) when the economy's productive capacity increases, i.e. in the situation of economic growth. This happens when:
- The quantity of resources increases — e.g. a larger labour force, discovery of new natural resources, more capital accumulation.
- Technology improves — better techniques of production raise productivity, so more of both goods can be produced from the same resources. …
- CGBSE Chhattisgarh Higher Secondary Class 12 (Commerce) 2023Set ANNUAL4 marksQ.OR (Question 15 alternative) Write the assumption of production possibility curve. (Any four)
›Reveal solutionSolution
The PPC assumes two goods, fixed and fully-employed resources, and given technology.
The production possibility curve (PPC) shows the various maximum combinations of two goods an economy can produce with its given resources and technology. Its assumptions (any four):
- Two goods only — The economy produces just two goods, so the trade-off can be shown on a two-dimensional diagram.
- Fixed resources — The total quantity of resources (factors of production) available is given and constant.
- Full and efficient employment — All resources are fully employed and used in the most efficient way (no idle or wasted resources).
- Given technology — The level of technology is given and does not change during the period. …
- CGBSE Chhattisgarh Higher Secondary Class 12 (Commerce) 2021Set ANNUAL4 marksQ.Write the assumptions of production possibility curve (any four).
›Reveal solutionSolution
The PPC assumes two goods, fixed and fully-employed resources, and given technology.
The production possibility curve (PPC) shows the different maximum combinations of two goods an economy can produce with its given resources and technology. It rests on the following assumptions (any four):
- Two goods only — The economy produces just two goods (say guns and butter) so the trade-off can be shown on a two-dimensional diagram.
- Fixed resources — The total quantity of resources (factors of production) available in the economy is given and constant.
- Full and efficient employment — All resources are fully employed and used in the most efficient way (no idle or wasted resources).
- Given technology — The level of technology (techniques of production) is given and does not change during the period. …
🎓Unlock everything free for 14 days
- ✓Full step-by-step solutions
- ✓Concept-first explanations
- ✓Methods, shortcuts & mistakes
- ✓PYQ mapping + timed mock tests
Full access for 14 days. No credit card required.