Raoult's Law: From Intuition to Precision
Imagine you have a beaker of pure water at room temperature. Some water molecules at the surface have enough energy to escape into the air above — that's vapour pressure. Now dissolve some sugar in that water. The sugar molecules take up space at the surface, blocking some water molecules from escaping. Fewer water molecules can leave the liquid per second, so the vapour pressure drops.
That's the core intuition: a non-volatile solute lowers the solvent's vapour pressure simply by getting in the way.
But what if both components can evaporate — say, a mixture of benzene and toluene? Then both kinds of molecules crowd the surface, and both contribute to the total vapour pressure. The question becomes: how much does each contribute?
The Precise Statement
For a solution of volatile liquids, Raoult's Law says:
pi=xipi∗
where:
- pi = partial vapour pressure of component i above the solution
- xi = mole fraction of component i in the liquid solution
- pi∗ = vapour pressure of pure component i at the same temperature
The law applies to each volatile component separately. The total vapour pressure above the solution is simply the sum:
Ptotal=p1+p2=x1p1∗+x2p2∗
What This Means Physically
The mole fraction xi tells you the fraction of molecules at the surface that are of type i. If half the molecules in the liquid are benzene (xbenzene=0.5), then roughly half the surface sites are occupied by benzene molecules. So the rate at which benzene escapes should be about half the rate from pure benzene — hence pbenzene=0.5×pbenzene∗.
This is a linear relationship: plot pi against xi, and you get a straight line from the origin (when xi=0, pi=0) up to pi∗ (when xi=1, pure component).
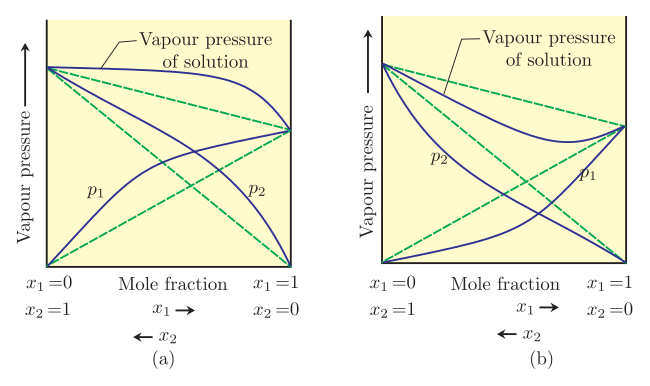
Raoult's Law is an idealisation. It works best when the two liquids are chemically similar — same type of intermolecular forces (e.g., both non-polar, or both with similar hydrogen bonding). Benzene–toluene is a classic example. When the molecules interact very differently (like ethanol and water), the law fails — that's when you get deviations from Raoult's Law.
A Concrete Example
Suppose you mix 2 moles of benzene (p∗=100 mm Hg) with 3 moles of toluene (p∗=40 mm Hg) at 25°C.
Mole fractions:
- xbenzene=2+32=0.4
- xtoluene=53=0.6
Partial pressures:
- pbenzene=0.4×100=40 mm Hg
- ptoluene=0.6×40=24 mm Hg
Total vapour pressure: 40+24=64 mm Hg
Notice: the total pressure is not a simple average of the pure pressures. It's a weighted average, with mole fractions as weights.
Why This Matters …