Q.(a)
🔒You're viewing a preview — the full solution, concept, methods & PYQ mapping are locked.
🔒 Start your 14-day free trial to unlock the full solution →Part (a)Concept understanding — Exponential Growth Rate
Exponential Growth Rate
A quantity grows exponentially when its rate of change is proportional to its current size: the more there is, the faster it grows. This differs sharply from linear growth, where a fixed amount is added each step. In exponential growth the quantity multiplies by the same factor over equal time intervals.
The differential equation
Let y(t) be the quantity and k>0 the proportionality constant. The rate law "rate of change proportional to the current amount" becomes
dtdy=ky.
This is a separable equation. Integrating,
∫ydy=∫kdt⟹log∣y∣=kt+C⟹y=y0ekt,
where y0=y(0) is the starting value. The constant k is the growth rate: a larger k means faster growth. (If k<0, the very same equation describes exponential decay.)
Reading the growth rate
Over each unit of time, y is multiplied by ek. So if the quantity doubles every unit of time, then ek=2, giving k=log2. This is how a stated doubling time is converted into the constant k.
Linear growth adds the same amount each step; exponential growth multiplies by the same factor. That is why an exponential quantity looks slow at first and then climbs steeply — the increase itself keeps getting bigger.
Where it appears …
Part (b)Concept understanding — Species Area Relationship
The Species Area Relationship: A First Look
Imagine you are walking through a small park near your home. You might spot a few birds, some insects, and a handful of plant species. Now imagine that same walk through a large forest reserve — hundreds of times bigger. Would you expect to see more kinds of birds, more types of insects, more varieties of trees? Almost certainly yes. That simple, intuitive observation is the seed of the Species Area Relationship.
What It Means
The Species Area Relationship (often abbreviated as SAR) is a pattern ecologists have observed across the natural world: as the area you sample increases, the number of species you find also increases. It is not a vague guess — it is a consistent, well-documented relationship that holds true for most groups of organisms, from plants and birds to insects and mammals.
Why does this happen? A larger area typically contains more habitats — forests, grasslands, wetlands, rocky outcrops — and each habitat supports its own set of species. A bigger area also tends to have more individuals, and with more individuals you are more likely to encounter rare species that might be absent from a small patch. In short, area acts as a rough proxy for ecological diversity and complexity.
Key Points to Remember
- The relationship is positive: bigger area → more species.
- It is not linear — doubling the area does not double the number of species. The increase slows down as area gets very large.
- The pattern holds across scales: from a single leaf (hosting tiny insects and fungi) to an entire continent.
The NCERT textbook for Class 12 Biology (Chapter 15, Biodiversity and Conservation) introduces this concept in the context of biodiversity patterns. It states that the relationship between species richness and area is described by a curve that rises rapidly at first and then flattens. The textbook does not require you to memorise any equation — only to understand the general trend and its implications.
Why It Matters
The Species Area Relationship is not just an academic curiosity. It has real-world consequences, especially for conservation.
- Designing protected areas: If you want to preserve a certain number of species, you need to know how much area is required. A small reserve may protect only a fraction of the region's biodiversity.
- Predicting extinctions: When a habitat is destroyed or fragmented, the remaining area shrinks. Using the SAR, ecologists can estimate how many species are likely to be lost as a result.
- Understanding island biology: The relationship was first studied on islands, where area is clearly defined and isolation limits immigration. The same logic applies to "habitat islands" — patches of forest surrounded by farmland, or national parks surrounded by cities. …
Part (a)
When resources are unlimited, every individual reproduces at its maximum rate and the population grows exponentially. The growth is described by dN/dt = rN, where N is population size and r is the intrinsic rate of natural increase (r = b - d). Integrating gives Nt = N0 e^(rt). Plotted against time this gives a J-shaped curve that rises ever more steeply, with no upper limit. …
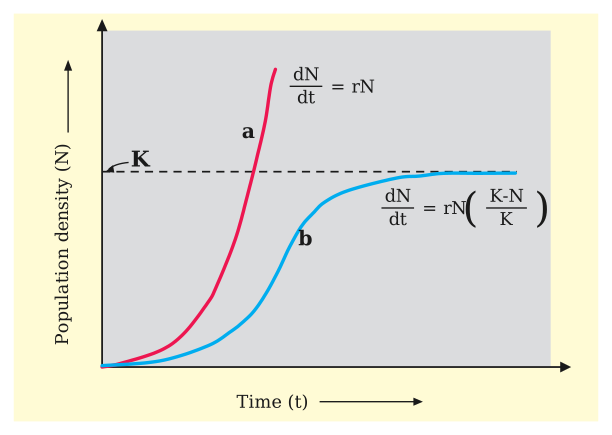
Part (a): With unlimited resources a population grows exponentially - a J-shaped curve given by dN/dt = rN and Nt = N0 e^(rt). Part (b): Humboldt found that species richness increases with area, expressed as the Species-Area relationship S = C A^z (a straight line on log-log axes).
Part (a)
Concept - exponential growth. If food and space are unlimited and there is no competition, each organism reproduces to its full potential, so the population increases multiplicatively.
If N is the population density at time t, b the per-capita birth rate and d the per-capita death rate, then:
dN/dt = (b - d) N = rN
where r is the intrinsic rate of natural increase. Integrating this gives:
Nt = N0 e^(rt)
with N0 the initial population and e the base of natural logarithms. …
Showing the 12 most recent of 13 on this concept.
- GUJCET 2026Set 051 markMCQQ.In a forest, there are initially 100 deer. Over a certain period 30 are born and 10 die. Assuming food is abundant and predators are few. Calculate the intrinsic rate of natural increase for that population. (A) 0.4 (B) 0.18 (C) 0.2 (D) 0.015
›Reveal solutionSolution
Intrinsic rate r = per-capita birth rate − per-capita death rate. …
- GSEB Higher Secondary Certificate (HSC) Examination 2026Set ANNUAL1 markMCQQ.Choose the correct equation of Exponential Growth.(a) dN/dt = rN(b) dT/dN = rN(c) dN/dt = rN [(K - N)/N](d) dN/dt = rN [(N - K)/K]
›Reveal solutionSolution
Exponential growth occurs when resources are unlimited, giving the simple growth equation dN/dt = rN.
When resources (food, space) in a habitat are unlimited, a population grows exponentially, described by dN/dt = rN, where N is population size, t is time, and r is the intrinsic rate of natural increase. This produces a J-shaped growth curve. In contrast, dN/dt = rN[(K-N)/K] describes logistic growth under limited/resource …
- GSEB Higher Secondary Certificate (HSC) Examination 2025Set ANNUAL1 markMCQQ.Which is the correct equation for the Verhulst-Pearl logistic growth model?(a) dN/dt = (d - b) N(b) dN/dt = rN (K / (K - N))(c) dN/dt = (b - d) N(d) dN/dt = rN ((K - N) / K)
›Reveal solutionSolution
The Verhulst-Pearl logistic growth equation models population growth that slows as it approaches the carrying capacity K.
Unlike exponential growth (dN/dt = rN), the logistic model accounts for limited resources: as population size N approaches the carrying capacity K, growth rate slows and eventually stops. The equation is dN/dt = rN[(K − N)/K], where the factor (K − N)/K approaches 1 when N is small (near- …
- GUJCET 2024Set 101 markMCQQ.Which naturalist gave species area relationship? (A) David Tilman (B) Edward Wilson (C) Alexander Von Humboldt (D) Paul Ehrlich
›Reveal solutionSolution
Alexander von Humboldt gave the species–area relationship.
The great naturalist Alexander von Humboldt observed that within a region species richness increases with explored area up to a limit, giving the species–area relationship (a rectangular hy …
- GSEB Higher Secondary Certificate (HSC) Examination 2024Set ANNUAL1 markMCQQ.Which of the following naturalist established species - area relationships?(a) Paul Ehrlich(b) Robert May(c) Alexander Von Humboldt(d) David Tilman
›Reveal solutionSolution
Alexander von Humboldt was the first to observe that, within a region, the number of species increases with explored area, but only up to a point — a curve later mathematically formalised by others.
While working on plant diversity across regions, von Humboldt found that species richness rose with sampled area, but the relationship was a curve rather than a straight line — it rises steeply at first and then flattens (approximated by the equation log S = log C + Z log A). Robert May is famous for his global estimates of species diversity, Pa …
- GSEB Higher Secondary Certificate (HSC) Examination 2024Set ANNUAL1 markMCQQ.Which of the following is correct equation for Verhulst Pearl Logistic growth?(a) dN/dt = rN(b) Nt = N0 e^rt(c) dN/dt = rN (K - N)/K(d) dN/dt = rN K/(K - N)
›Reveal solutionSolution
The logistic (Verhulst-Pearl) growth model describes population growth that slows as it approaches the environment's carrying capacity K, captured by the equation dN/dt = rN(K-N)/K.
Unlike exponential growth (dN/dt = rN, or Nt = N0.e^rt), which assumes unlimited resources and grows indefinitely, the logistic model recognises that resources are always finite. It introduces the carrying capacity K — the maximum population size an environment can sustain — and the term (K-N)/K acts as a brake: when N is small relative to K, this term is close to 1 and growth is nea …
- GUJCET 2023Set 071 markMCQQ.In species-Area relationship, select the naturalist and geographer who observed that within a region species richness increased with increasing explored area, but only up to a limit. (A) Paul Ehrlich (B) Alexander Von Humboldt (C) Edward Wilson (D) David Tilman
›Reveal solutionSolution
The naturalist–geographer behind the species–area relationship is Alexander von Humboldt.
Concept: Alexander von Humboldt, exploring South American jungles, observed that within a region species richness increased with the explored area, but only up to a limit. This gave the speci …
- GUJCET 2022Set 171 markMCQQ."That within a region species richness increased with increasing explored area, but only upto a limit." Which naturalist has proposed this statement? (A) Paul Ehrlich (B) David Tilman (C) Alexander von Humboldt (D) Trashow
›Reveal solutionSolution
The species–area relationship was proposed by Alexander von Humboldt.
Concept. The German naturalist Alexander von Humboldt observed that within a region, species richness increases with the explored area, but only up to a limit — the basis of the s …
- GSEB Higher Secondary Certificate (HSC) Examination 2022Set ANNUAL1 markMCQQ.When reactions do not limit growth, the graph is ..............(a) 'S' shaped(b) 'J' shaped(c) 'L' shaped(d) 'K' shaped
›Reveal solutionSolution
When resources (food, space) are not limiting, a population grows exponentially, producing a 'J'-shaped growth curve.
Population growth follows two idealised models: exponential growth, which occurs when resources in the environment are unlimited, allowing the population to grow at its maximum intrinsic rate (dN/dt = rN) without any environmental resistance — plotted, this produces a 'J'-shaped curve that keeps rising steeply. In contrast, when resources …
- GUJCET 2021Set 151 markMCQQ.Logistic Growth is expressed by which of the following equation? (A) dN/dt=rN(KK−N) (B) dN/dt=rN (C) Nt=Noert (D) dN/dt=N(KK−N)
›Reveal solutionSolution
Logistic growth includes the carrying-capacity term (K-N)/K.
Concept. dtdN=rN(KK−N) describes density-dependent (logistic) growth. …
- GUJCET 2021Set 151 markMCQQ.'Species-Area relationships' was given by which scientist? (A) Allen (B) Alexander von Humboldt (C) Paul Ehrlick (D) Gause
›Reveal solutionSolution
Alexander von Humboldt first described the species-area relationship.
Concept. The rectangular hyperbola S=CAz relating species richness to area was proposed by Alexander von Humboldt. …
- GSEB Higher Secondary Certificate (HSC) Examination 2020Set ANNUAL1 markMCQQ.log S = log C + Z log A equation indicate(a) Biodiversity(b) Species area relationships(c) Loss of biodiversity(d) Latitudinal gradient
›Reveal solutionSolution
Alexander von Humboldt's species-area relationship, expressed as log S = log C + Z log A, shows that within a region, species richness increases with explored area, but only up to a limit, following this logarithmic relationship.
Ecologists have long observed that species richness (S) of a region tends to increase with the area (A) surveyed, but only up to a certain limit; the relationship, for a wide variety of taxa (plants, birds, bats, freshwater fish), turns out to be a rectangular hyperbola. When plotted on a logarithmic scale, the relationship becomes a straight line described by the equation: log S = log C + Z log A, where Z is the slope of the line (regression coefficient) a …
🎓Unlock everything free for 14 days
- ✓Full step-by-step solutions
- ✓Concept-first explanations
- ✓Methods, shortcuts & mistakes
- ✓PYQ mapping + timed mock tests
Full access for 14 days. No credit card required.