Biology · Ch 15 — Body Fluids and Circulation
Electrocardiogram (ECG)
Electrocardiogram (ECG)
An electrocardiogram (ECG) is a graphical record of the electrical activity of the heart across a single cardiac cycle. The device that produces it is the electrocardiograph — the same monitor seen in hospital dramas, tracing the heart's voltage on a screen.
How a standard ECG is recorded
To obtain a standard ECG, the patient is connected to the machine through three electrical leads — one attached to each wrist and one to the left ankle — which continuously pick up the heart's electrical activity. When a doctor needs a more detailed evaluation of heart function, several additional leads are placed over the chest region. The discussion here is limited to the standard three-lead ECG.
The waves and what they mean
Each peak on the trace is labelled with a letter from P to T, and every letter corresponds to a specific electrical event in the heart.
- P-wave — represents the electrical excitation, or depolarisation, of the atria. This is what leads to the contraction of both atria.
- QRS complex — represents the depolarisation of the ventricles, which sets off ventricular contraction. Contraction begins shortly after the Q point, marking the start of systole.
- T-wave — represents the repolarisation of the ventricles, that is, their return from the excited state back to normal. The end of the T-wave marks the end of systole.
Why it matters …
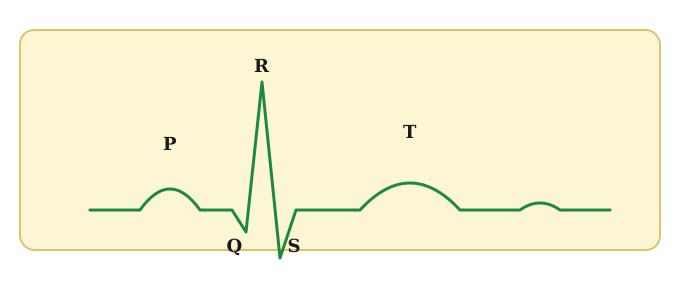
Drawn by us to help you understand the concept clearly, and verified to make sure it's accurate. For exams, practice from your textbook's own diagram.
This figure is a standard electrocardiogram, the wavy trace that records the heart's electrical activity across one cardiac cycle. Reading it from left to right, you first meet the small P-wave. It stands for the depolarisation, or electrical excitation, of the atria, and it is this event that triggers the atria to contract. Next comes the tall, sharp QRS complex, the largest deflection on the trace; it marks the depolarisation of the ventricles and sets off their powerful contraction, so the beginning of the QRS marks the start of systole. Finally the rounded T-wave records the repolarisation of the ventricles, their return from the excited state back to rest, and its end marks the close of systole. From this figure a student should learn to link each labelled wave to a specific electrical event in the heart, and to see that a healthy trace repeats …