Q.Draw the graph to show variation of capacitive reactance (Xс) with frequency of the a.c source used.
🔒You're viewing a preview — the full solution, concept, methods & PYQ mapping are locked.
🔒 Start your 14-day free trial to unlock the full solution →Concept understanding — AC Through a Capacitor
AC Through a Capacitor — From Intuition to the Exact Statement
Imagine a capacitor as a tiny, two-plate storage tank for charge. When you connect it to a DC battery, it charges up quickly and then blocks any further current — that's why a capacitor is an open circuit for steady DC. But AC is different: the voltage keeps reversing, so the capacitor never gets a chance to settle. It is constantly being charged, discharged, charged the other way, discharged again — and that motion of charge is an alternating current.
The key intuition: current flows because the voltage is changing. If the voltage were steady, no current would flow. The faster the voltage changes, the larger the current. This is the opposite of a resistor, where current depends on the voltage itself, not its rate of change.
The Mathematical Link
For a capacitor, the charge stored is Q=CV. Current is the rate of flow of charge: I=dQ/dt. So:
I=CdtdV
This single equation is the whole story. If the applied voltage is sinusoidal, say V=V0sin(ωt), then:
I=Cdtd[V0sin(ωt)]=CV0ωcos(ωt)
Now compare the two waveforms:
- Voltage: V0sin(ωt) — starts at zero, rises to peak.
- Current: CV0ωcos(ωt) — starts at its maximum value, then falls.
A cosine is a sine shifted forward by 90∘ (or π/2 radians). So the current reaches its peak a quarter-cycle before the voltage does. That is the famous result: in a purely capacitive circuit, current leads voltage by 90∘.
The phase relation: I leads V by 90∘ in a pure capacitor. Equivalently, V lags I by 90∘.
Why "Leads" and Not "Lags"?
Think physically. At the instant you first apply the AC voltage, the voltage is zero but rising fastest (the slope of sin is maximum at zero). A fast-changing voltage means a large current. So the current is already at its peak while the voltage is still near zero. That is the meaning of "leading" — the current's peak comes first.
Later, when the voltage reaches its peak, it is momentarily not changing (slope = 0), so the current drops to zero. The current is always ahead of the voltage by exactly one quarter-cycle.
The Limiting Factor: Capacitive Reactance
From the current expression above, the peak current is:
I0=ωCV0
This looks like Ohm's law if we define an effective resistance-like quantity:
XC=I0V0=ωC1
This XC is called capacitive reactance. It has units of ohms, but it is not a resistance — it does not dissipate energy. It merely limits the current by the capacitor's opposition to changes in voltage.
XC=ωC1=2πfC1
Key points about XC:
- It is inversely proportional to frequency. At high f, the voltage changes rapidly, so the current is large — low reactance. At low f, the voltage changes slowly, so the current is small — high reactance. At DC (f=0), XC→∞, which is the open-circuit behaviour you already know.
- It is also inversely proportional to capacitance C. A larger capacitor stores more charge per volt, so for the same voltage change it pushes more current — lower reactance.
The Complete Picture in One Table
| Property | Resistor | Capacitor |
|---|---|---|
| Relation | V=IR | I=CdV/dt |
Since XC=1/(2πfC) for a fixed capacitor, XC varies inversely with frequency, which fixes the shape of the graph relating the two quantities. …
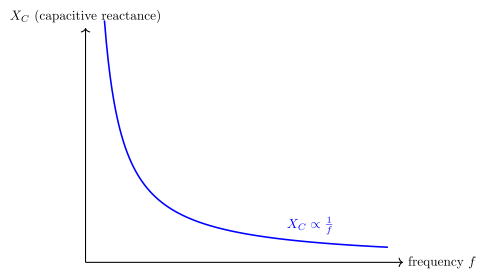
Capacitive reactance is inversely proportional to frequency, giving a hyperbola-shaped falling curve on the Xc–f axes.
Capacitive reactance is given by:
XC=2πfC1=ωC1
Since C is constant for a given capacitor, XC∝f1 — an inverse relationship. This means:
- As f→0, XC→∞ (a capacitor blocks DC).
- As f→∞, XC→0 (a capacitor behaves like a short circuit at very high frequency). …
- CBSE 2026Set A1 markMCQQ.In an ac circuit of capacitance the current from potential difference is (A) forward (B) backward (C) both are in same phase (D) none of these
›Reveal solutionSolution
In a pure capacitor the current leads the applied voltage by π/2, i.e. current is ahead (forward).
For a capacitor driven by V=V0sinωt, the charge is q=CV and the current is
I=dtdq=ωCV0cosωt=ωCV0sin(ωt+2π).
…
- CBSE 2025Set D1 markMCQQ.In an a.c. circuit containing only capacitor, the phase difference between current and voltage is (A) 0° (B) 90° (C) 180° (D) 45°
›Reveal solutionSolution
In a pure capacitor the current leads the applied voltage by a quarter cycle, i.e. a phase difference of 90°.
For an a.c. circuit containing only a capacitor, the charging current is maximum when the voltage is zero and vice versa. The current leads the voltage by
…
- CBSE 2025Set ANNUAL1 markQ.Draw the phasor diagram to represent current and supply voltage for an AC circuit containing capacitance only.
›Reveal solutionSolution
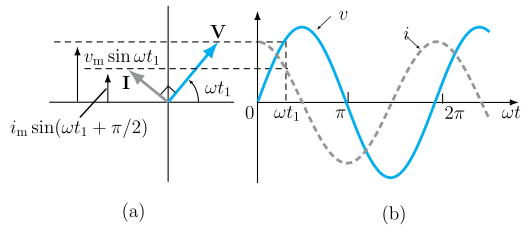
Figure — Explicit 'Draw the phasor diagram ... AC circuit containing capacitance only' hard gate. Catalog fig-7-8 is ex In a pure capacitor, I leads V by π/2.
In an AC circuit containing only a capacitor, the current leads the applied voltage by a phase angle of 90° (π/2 radians) — this follows from I=CdtdV, since the current is proportional to the rate of change of voltage, which is largest when V is crossing zero and zero when V is at its peak. In the phasor diagram, the voltage phasor V0 is drawn along the reference (horizontal) axis, and the current phasor I0 is drawn rot …
- CBSE 2024Set FS1 markMCQQ.The power consumed in alternating current in circuit containing only capacitor will be:(i) P=−1(ii) P=0(iii) P=+1(iv) None of the above
›Reveal solutionSolution
In a purely capacitive AC circuit current leads voltage by 90∘, so cosϕ=0 and the average power consumed is zero — option (ii).
Concept. Average AC power is P=VrmsIrmscosϕ, where ϕ is the phase angle between voltage and current.
Why zero. In a circuit with only a capacitor, the current leads the voltage by exactly ϕ=90∘. Then …
- CBSE 2023Set F1 markMCQQ.The phase-difference between current and voltage in only capacitive alternating current circuit is (A) 0° (B) 90° (C) 180° (D) 45°
›Reveal solutionSolution
In a purely capacitive AC circuit, current leads voltage by a phase angle of 90°.
For a pure capacitor, if V=V0sinωt then the charge q=CV0sinωt and the current
I=dtdq=ωCV0cosωt=I0sin(ωt+2π)
…
- CBSE 2023Set B1 markMCQQ.The phase difference between flowing current and applied voltage in alternating circuit containing pure capacitor is(i) 0(ii) 1(iii) π/2(iv) −π/2
›Reveal solutionSolution
In a purely capacitive AC circuit the current leads the voltage by π/2 (equivalently, voltage lags current by 90°).
For a capacitor of capacitance C connected to an alternating voltage v=v0sin(ωt), the charge on the capacitor is q=Cv=Cv0sin(ωt). The current is the rate of change of charge:
i=dtdq=Cv0ωcos(ωt)=i0sin(ωt+2π) …
- CBSE 2020Set ANNUAL1 markQ.What is the value of power factor of a purely capacitive ac circuit?
›Reveal solutionSolution
In a purely capacitive AC circuit the current leads the voltage by 90°, so cos φ = cos 90° = 0.
Power factor is defined as cosϕ, where ϕ is the phase difference between voltage and current. In a purely capacitive circuit, ϕ=90°, so cosϕ=0. This means the average power consumed, Pavg=VrmsIrmscosϕ, is zero — …
- CBSE 2019Set ANNUAL1 markMCQQ.The power factor for a purely capacitive circuit is:(a) 1(b) √2(c) 1/√2(d) Zero
›Reveal solutionSolution
In a purely capacitive AC circuit the current leads the voltage by 90∘, so the power factor cosϕ=cos90∘=0.
Power factor is defined as cosϕ, where ϕ is the phase angle between the applied voltage and the current. In a pure capacitor, current leads voltage by exactly ϕ=90∘ (no resistance to dissipate energy — the capacitor only stores and returns energy each half-c …
- CBSE 2019Set ANNUAL1 markMCQQ.Which of the following devices does not allow d.c. to pass through ?(a) resistor(b) capacitor(c) inductor(d) all the above
›Reveal solutionSolution
A capacitor blocks steady direct current once fully charged, whereas a resistor and an ideal inductor both allow d.c. to flow continuously.
A resistor obeys Ohm's law V=IR for both d.c. and a.c.; it offers a fixed opposition to current and allows a steady direct current to flow continuously as long as a potential difference is maintained across it.
An inductor opposes only a change in current, through the induced back-emf e=−LdtdI. For a steady (unchanging) direct current, dtdI=0, so the induced emf is zero and the inductor offers no opposition -- d.c. flows through it freely once the current has settled to a constant value (it behaves essentially like a plain conductor).
…
- CBSE 2018Set ANNUAL1 markMCQQ.Which of the following devices does not allow d.c. to pass through ?(a) capacitor(b) inductor(c) resistor(d) all the above
›Reveal solutionSolution
A capacitor does not allow direct current to flow through it in the steady state.
In a d.c. circuit, once a capacitor is charged to the applied voltage, no further charge flows onto its plates and the current becomes zero — the capacitor behaves like an open circuit for steady d.c. An inductor, by contrast, offers zero opposition to steady d.c. (since V=LdI/dt=0 for constant current) and behaves like a plain wire. A resistor always allows d.c. to pass, since Ohm's law …
🎓Unlock everything free for 14 days
- ✓Full step-by-step solutions
- ✓Concept-first explanations
- ✓Methods, shortcuts & mistakes
- ✓PYQ mapping + timed mock tests
Full access for 14 days. No credit card required.