Economics · Ch 4 — Presentation of Data
Ogive
Ogive
An ogive, also called the cumulative frequency curve, plots cumulative frequencies (instead of simple frequencies) along the y-axis against the class limits. Because cumulative frequency can be counted two ways, there are two ogives for any grouped distribution:
- The 'less than' ogive plots each cumulative frequency against the upper limit of its class. It is never decreasing (it rises or stays level).
- The 'more than' ogive plots each cumulative frequency against the lower limit of its class. It is never increasing (it falls or stays level). …
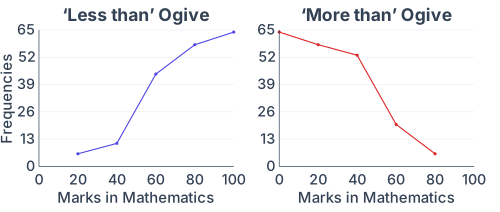
Drawn by us to help you understand the concept clearly, and verified to make sure it's accurate. For exams, practice from your textbook's own diagram.
Two cumulative-frequency curves (ogives) drawn separately. The 'less than' ogive plots cumulative frequency against the upper class limit — points (20,6),(40,11),(60,44),(80,58),(100,64) — giving a rising, never-decreasing curve. The 'more than' ogive plots cumulative frequency against the lower class limit — (0,64),(20,58),(40,53),(60,20),(80,6) — giving a falling curve. Reading eit …
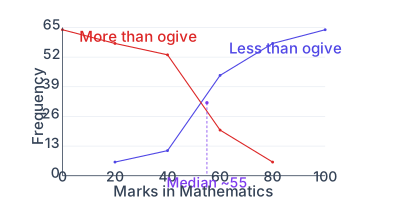
Drawn by us to help you understand the concept clearly, and verified to make sure it's accurate. For exams, practice from your textbook's own diagram.
Both ogives drawn on one set of axes: the rising 'less than' curve and the falling 'more than' curve for the same marks data. Where the two curves cross, an equal number of students lie below and above that value, so a dotted line dropped from the intersection to the x-axis reads off the Median ( marks). Plotting both together …
Table 4.10(a) — frequency distribution
| Marks | Number of students |
|---|---|
| 0–20 | 6 |
| 20–40 | 5 |
| 40–60 | 33 |
| 60–80 | 14 |
| 80–100 | 6 |
| Total | 64 |
Table 4.10(b) — 'Less than' cumulative frequency distribution
| Marks | 'Less than' cumulative frequency |
|---|---|
| Less than 20 | 6 |
| Less than 40 | 11 |
| Less than 60 | 44 |
| Less than 80 | 58 |
| Less than 100 | 64 |
Table 4.10(c) — 'More than' cumulative frequency distribution
| Marks | 'More than' cumulative frequency |
|---|---| …