Chemistry · Ch 7 — Equilibrium
The pH Scale
The pH Scale
The pH Scale
The concentration of hydronium ions in a solution is often a very small number expressed in scientific notation. Working with such numbers directly can be cumbersome. To make this easier, chemists use a logarithmic scale called the pH scale.
The pH of a solution is defined as the negative logarithm (to base 10) of the activity of hydrogen ions (). In dilute solutions (concentration less than 0.01 M), the activity of hydrogen ions is numerically equal to its molarity, represented by . Activity itself is a dimensionless quantity, defined as .
Therefore, the definition of pH simplifies to:
For a M HCl solution, M, so . For a basic NaOH solution with M, the hydronium ion concentration is M, giving a pH of 10.
At 25 °C, pure water has M, so its pH is:
This gives us the standard classification of aqueous solutions at 25 °C:
- Acidic solution: M, so
- Basic solution: M, so
- Neutral solution: M, so
The pH of some common fluids, exactly as the textbook's Table 6.5 lists them:
| Name of the Fluid | pH | Name of the Fluid | pH |
|---|---|---|---|
| Saturated solution of NaOH | ~15 | Black coffee | 5.0 |
| 0.1 M NaOH solution | 13 | Tomato juice | ~4.2 |
| Lime water | 10.5 | Soft drinks and vinegar | ~3.0 |
| Milk of magnesia | 10 | Lemon juice | ~2.2 |
| Egg white, sea water | 7.8 | Gastric juice | ~1.2 |
| Human blood | 7.4 | 1M HCl solution | ~0 |
| Milk | 6.8 | Concentrated HCl | ~–1.0 |
| Human saliva | 6.4 |
The pH = 7 for neutrality is only true at 25 °C. Since changes with temperature, the pH of a neutral solution changes as well. At 100 °C, for example, , so a neutral solution has pH ≈ 6.1.
The Relationship Between pH and pOH
Recall the autoionization constant of water at 298 K:
Taking the negative logarithm (base 10) of both sides gives:
We define , , and . This yields the fundamental relationship:
This equation is the master link between pH and pOH. In any aqueous solution at 25 °C, if you know one, you know the other. For example, a solution with pH = 3 has pOH = 11.
The Logarithmic Nature of the pH Scale
Because pH is a logarithmic scale, a change of one pH unit corresponds to a tenfold change in . A change of two pH units corresponds to a hundredfold change in . This is why small temperature-induced changes in (and thus in the pH of neutral water) are often ignored — they represent tiny changes in that are negligible for most practical purposes.
Measuring pH
Knowing the pH of a solution is essential in many fields, especially biology and cosmetics. Two common methods are used: …
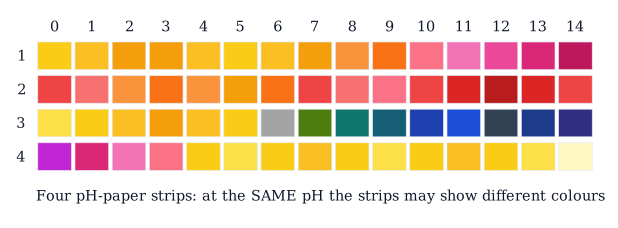
Drawn by us to help you understand the concept clearly, and verified to make sure it's accurate. For exams, practice from your textbook's own diagram.
The figure is a visual demonstration of a subtle but important point: pH paper does not give a single, universal colour for a given pH. Instead, the colour you see depends on the specific mixture of indicator dyes impregnated into that particular batch of paper.
The chart itself is a vertical strip showing the full pH range from 0 to 14. At pH 0, the colour is a deep, dark red. As the pH increases through 1, 2, and into the acidic range, the colour shifts through orange and then into yellow. At pH 7, exactly neutral, the colour is a yellow-green. Moving into the basic range (pH 8 to 14), the colour transitions through green and blue, finally ending in a dark purple at pH 14.
The key feature of the figure is that it shows four horizontal strips running across this vertical scale. Each strip is a separate piece of pH paper that has been dipped into a solution of a specific pH. The crucial observation is that for the same pH value, the four strips do not show identical colours. One strip might be a slightly different shade of orange at pH 3 compared to another. This is not an error; it is the entire point of the figure.
A common mistake is to assume that pH paper gives an exact, unambiguous colour match. This figure shows that different batches or brands of pH paper can give slightly different shades for the same pH. You should never rely on a single, memorised colour for a pH value.
The physical idea the figure teaches is that pH paper is a semi-quantitative tool. It is excellent for quickly determining whether a solution is acidic, basic, or neutral, and for getting a rough estimate of the pH. However, it is not precise enough to distinguish between, say, pH 4.0 and pH 4.2. The variation between strips at the same pH is a direct consequence of the fact that the indicator dyes used are not perfectly pure, and their exact proportions vary from one manufacturer to another.
The textbook develops this figure alongside the concept of the pH scale and the autoionization of water. The central formula that defines pH is:
where is the molar concentration of hydrogen ions in the solution.
This formula is the mathematical definition of pH. The figure is the practical, visual counterpart to this equation. The colour chart is a translation of the abstract number (pH) into a visible colour. The variation between the strips reminds you that this translation is not perfect — the colour is a function of the indicator mixture, not just the pH itself.
The autoionization constant of water, , is also directly related:
From this, we get the relationship . The figure's scale from 0 to 14 is a direct consequence of this constant. The neutral point (pH 7) is where , which is why the colour at pH 7 is a distinct yellow-green, different from the acidic yellows and the basic greens. …