Chemistry · Ch 9 — Organic Chemistry – Some Basic Principles and Techniques
Chromatography
Chromatography
Chromatography is a separation technique that has become indispensable in organic chemistry. The name comes from the Greek chroma (colour) because the method was first used to separate coloured plant pigments. Today it is used for mixtures of any kind — coloured or colourless — to separate components, purify compounds, and test purity.
The core idea is simple: a mixture is placed on a stationary phase (a solid or a liquid held in place), and a mobile phase (a pure solvent, a mixture of solvents, or a gas) is allowed to move slowly over it. As the mobile phase travels, the different components of the mixture travel at different speeds and get separated from one another. The basis of separation can be either adsorption or partition, giving two broad classes of chromatography.
Adsorption Chromatography
Adsorption chromatography works because different compounds are adsorbed onto a solid surface to different degrees. The stationary phase is an adsorbent — a solid that holds molecules on its surface. The most common adsorbents are silica gel (SiO₂·xH₂O) and alumina (Al₂O₃). When the mobile phase flows over the adsorbent, each component of the mixture moves a different distance depending on how strongly it is adsorbed. The more strongly a compound is adsorbed, the shorter the distance it travels.
Two main techniques are based on this principle: column chromatography and thin layer chromatography.
Column Chromatography
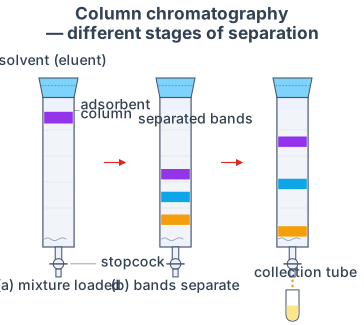
In column chromatography, the adsorbent is packed into a vertical glass tube fitted with a stopcock at the bottom. The mixture to be separated is first adsorbed onto a small amount of adsorbent and then placed on top of the packed column. An eluant — a liquid or a mixture of liquids — is allowed to flow slowly down the column by gravity.
As the eluant passes through, the components of the mixture are carried downward at different rates. The most strongly adsorbed substances remain near the top of the column, while less strongly adsorbed ones travel further down. By collecting the liquid that drips out of the stopcock in separate fractions, the components can be obtained in pure form.
Drawn by us to help you understand the concept clearly, and verified to make sure it's accurate. For exams, practice from your textbook's own diagram.
Column chromatography is a physical separation method that relies on differences in how strongly each component of a mixture adsorbs to a solid surface. Figure 8.11 in your textbook captures the entire process in a single, clear schematic.
The figure shows a long, vertical glass tube — the column — packed with a finely divided solid called the adsorbent (typically silica gel or alumina). This packed solid is the stationary phase. At the bottom of the column is a stopcock (a tap) that controls the flow of liquid. The column is filled with a solvent, the eluent, which is the mobile phase.
The diagram is essentially a time-lapse of the column, shown as three stages, each a different stage of the separation.
Stage 1 — Loading. At the very top of the column, a narrow band of the mixture (the sample) is shown. At this point, all components are concentrated in one zone.
Stage 2 — Elution begins. The stopcock is opened, and fresh eluent is continuously added to the top. As the eluent flows down under gravity, it carries the sample with it. The figure now shows the single band beginning to spread and separate into two or more distinct coloured bands. Each band corresponds to a different compound. The key visual here is that the bands are not moving at the same speed — one is clearly ahead of the others.
Stage 3 — Complete separation. The bands are now fully resolved, with clear gaps of clean adsorbent between them. The fastest-moving band (the one that travelled the furthest) is approaching the bottom of the column. The figure often labels this band as the least-adsorbed component — it spends more time in the mobile phase and less time stuck to the stationary phase, so it moves faster.
Stage 4 — Collection. The lowest band has now reached the bottom of the column and is dripping out through the stopcock into a collection tube (a test tube or flask). The figure shows that different collection tubes are used for different bands, so each pure compound is collected separately.
What the figure does not show is a graph. There is no x-axis or y-axis. The "plot" is the column itself — the vertical distance travelled is the separation coordinate, and the colour/intensity of each band represents the concentration of that compound at that position.
The physical idea the figure teaches is beautifully simple: adsorption is reversible. Each molecule in the mixture constantly partitions between being stuck to the stationary phase and being dissolved in the moving eluent. The more strongly a compound adsorbs, the more time it spends stuck, and the slower it moves down the column. The less it adsorbs, the faster it travels. …
The word "eluant" (or "eluent") refers to the solvent that carries the components through the column. The process of passing eluant through the column is called elution.
Thin Layer Chromatography (TLC)
Thin layer chromatography uses a thin layer (about 0.2 mm thick) of adsorbent — again silica gel or alumina — spread evenly on a glass plate. This plate is called a TLC plate or chromaplate.
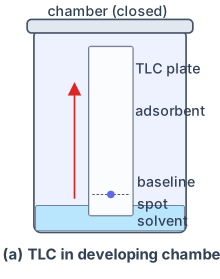
A small spot of the mixture solution is applied about 2 cm above one end of the plate. The plate is then placed upright in a closed jar containing a shallow layer of eluant, making sure the spot is above the solvent level. The eluant rises up the plate by capillary action. As it passes over the spot, the components of the mixture are carried upward to different heights depending on their degree of adsorption.
Drawn by us to help you understand the concept clearly, and verified to make sure it's accurate. For exams, practice from your textbook's own diagram.
A glass plate coated with a thin (about 0.2 mm) layer of adsorbent — the stationary phase, usually silica gel or alumina — stands upright in a closed jar containing a shallow pool of the mobile phase (the eluent). The sample is spotted near the bottom of the plate, above the solvent level, and the lid keeps the chamber atmosphere saturated so the solvent does not evaporate off the plate as it climbs.
The adsorbent layer is porous, so capillary action draws the solvent up the plate. As the solvent front passes the sample spot, each component in the mixture is carried along at its own rate: a compound that sticks strongly to the adsorbent lags behind, while one that prefers the moving solvent travels quickly. That difference in speed is what pulls the mixture apart into separate spots. …
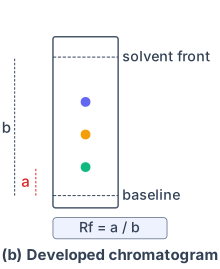
The distance each component travels relative to the solvent front is expressed as its retardation factor, or Rf value:
Both distances are measured from the original spot position (the base line). The Rf value is always between 0 and 1. A substance that is strongly adsorbed will have a small Rf value; one that is weakly adsorbed will have a larger Rf value.
Drawn by us to help you understand the concept clearly, and verified to make sure it's accurate. For exams, practice from your textbook's own diagram.
After the solvent has risen nearly to the top, the plate is removed and dried. Three landmarks are read off it: the baseline where the mixture was originally spotted, the solvent front — the highest point the solvent reached, marked immediately in pencil before it evaporates — and, between them, the separated spots, one per component. The spot nearest the baseline is the most strongly adsorbed (slowest) compound; the one nearest the front is the least adsorbed (fastest).
Two distances are measured from the baseline: , the distance travelled by a substance, and , the distance travelled by the solvent front.
…
Rf values depend on the specific adsorbent, the solvent system, and the temperature. For reliable identification, run a known pure compound alongside the unknown mixture on the same plate.
Detecting spots on a TLC plate:
- Coloured compounds are visible directly.
- Colourless compounds that fluoresce under ultraviolet light can be seen by placing the plate under a UV lamp.
- Placing the plate in a jar with a few iodine crystals causes spots of compounds that adsorb iodine to appear brown.
- A suitable spray reagent can be used. For example, amino acids are detected by spraying with ninhydrin solution, which produces a purple colour.
Partition Chromatography
Partition chromatography is based on a different principle: the continuous differential partitioning of components between two liquid phases. One liquid is held stationary on a solid support, and the other liquid (the mobile phase) moves over it. The components distribute themselves between the two phases according to their relative solubilities.
Paper Chromatography
Paper chromatography is the most common type of partition chromatography. A special chromatography paper is used. This paper contains water trapped in its fibres, and this trapped water acts as the stationary phase. …
Drawn by us to help you understand the concept clearly, and verified to make sure it's accurate. For exams, practice from your textbook's own diagram.
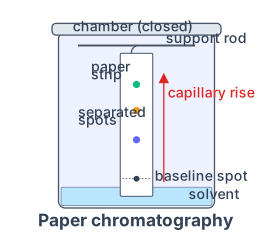
Paper chromatography is one of the simplest and most visual ways to separate a mixture of coloured compounds. The figure shows a tall, narrow strip of chromatography paper suspended inside a closed glass jar. The bottom edge of the paper dips into a shallow layer of solvent (the mobile phase), but the sample — a small, concentrated spot of the mixture — is placed a few centimetres above the solvent surface, not in it.
The jar is sealed so that the atmosphere inside becomes saturated with solvent vapour. This prevents the solvent from evaporating too quickly as it climbs the paper. The paper itself is the stationary phase: it is made of cellulose, which is polar and holds a thin film of adsorbed water molecules.
The physical idea is capillary action. The solvent creeps up the paper by the adhesive and cohesive forces between the liquid and the cellulose fibres. As the solvent front passes through the sample spot, it dissolves the different components of the mixture. Each component then partitions between the moving solvent and the stationary water layer on the paper. A compound that is more soluble in the mobile phase (or less strongly adsorbed by the paper) travels faster and gets carried higher up the strip. A compound that sticks more strongly to the stationary phase lags behind. Over time, the original single spot separates into a vertical series of distinct spots, each at a characteristic height.
The figure does not have labelled axes in the usual graph sense. Instead, the vertical dimension of the paper strip itself acts as the axis of separation. The bottom of the strip is the starting line (where the sample was originally spotted), and the top is the solvent front — the highest point the solvent reached before the experiment was stopped. The key measurement is the distance each spot has travelled from the starting line.
The same retardation factor, or value (introduced with the TLC plate, Fig 8.12b), which is a constant for a given compound under fixed conditions of solvent, temperature, and paper type.
Here:
- distance travelled by the substance is measured from the centre of the original sample spot (the starting line) to the centre of the separated spot after development.
- distance travelled by the solvent front is measured from the same starting line to the leading edge of the solvent at the end of the run.
Both distances are measured in the same units (usually centimetres), so is a dimensionless number between 0 and 1. A value close to 1 means the compound moved almost as fast as the solvent — it has little affinity for the stationary phase. A value near 0 means it barely moved — it is strongly adsorbed. …