Economics · Ch 14 — Employment: Growth, Informalisation and Other Issues
Growth and Changing Structure of Employment
Growth and Changing Structure of Employment
Two indicators: employment growth and GDP growth
Nearly seventy years of planned development have aimed at expanding the economy by raising both national output and employment. Between 1950 and 2010 India's GDP grew steadily and was higher than employment growth, though GDP growth itself kept fluctuating. Over this period, employment grew at no more than about 2 per cent a year.
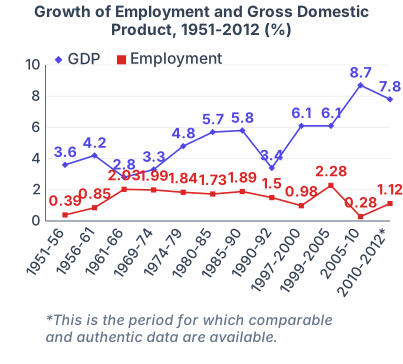
Drawn by us to help you understand the concept clearly, and verified to make sure it's accurate. For exams, practice from your textbook's own diagram.
GDP growth stayed well above employment growth throughout, and the gap widened in the later periods — GDP reached 8.7% and 7.8% in the final two periods while employment growth never rose above about 2.3% across the whole series. This is the chart's own illustration of 'jobless growth': output expan …
Jobless growth
Chart 6.3 also points to a disheartening development in the late 1990s: employment growth started declining and fell back towards the low rates India had seen in the early stages of planning, while the gap between GDP growth and employment growth widened. In other words, the Indian economy has managed to produce more goods and services without generating matching employment — scholars call this phenomenon jobless growth.
The changing structure of employment
Because India is an agrarian nation with a large rural population dependent on farming, development strategy — in India as in many countries — has aimed at reducing the share of people depending on agriculture. The distribution of the workforce by industrial sector shows a substantial shift from farm to non-farm work: in 1972-73, about 74 per cent of the workforce was engaged in the primary sector; by 2011-12 this had declined to about 50 per cent, while the secondary and service sectors' shares rose from about 11 to 24 per cent and about 15 to 27 per cent respectively.
| Item | 1972-73 | 1983 | 1993-94 | 2011-2012 | 2017-2018 |
|---|---|---|---|---|---|
| Sector | |||||
| Primary | 74.3 | 68.6 | 64 | 48.9 | 44.6 |
| Secondary | 10.9 | 11.5 | 16 | 24.3 | 24.4 |
| Services | 14.8 | 16.9 | 20 | 26.8 | 31.0 |
| Total | 100.0 | 100.0 | 100.0 | 100.0 | 100.0 |
| Status | |||||
| Self-employed | 61.4 | 57.3 | 54.6 | 52.0 | 52.2 |
| Regular Salaried Employees | 15.4 | 13.8 | 13.6 | 18.0 | 22.8 |
The distribution of the workforce by status shows that, over the five decades from 1972 to 2018, people moved away from self-employment and regular salaried employment towards casual wage work — yet self-employment continues to be the largest single employment provider. Looking at the last (2017-2018) column of the table: how do you understand the stagnation of the secondary sector and the moderate rise in self-employment during 2011-18? Discuss it in class. Scholars call the movement from self-employment and regular salaried work towards casual wage work, noticed during 1972-94, the casualisation of the workforce — this makes workers highly vulnerable (see the Ahmedabad case study in the next section). In the meantime, notice too that 2017-18 shows a moderate rise in the share of regular salaried employees — how would you explain this?
Work These Out
- Is maintaining employment growth at 2 per cent an easy thing for a country like India? Why? …