Mathematics and Statistics · Ch 10 — Partition Values
Graphical Location using the Ogive
Graphical Location using the Ogive
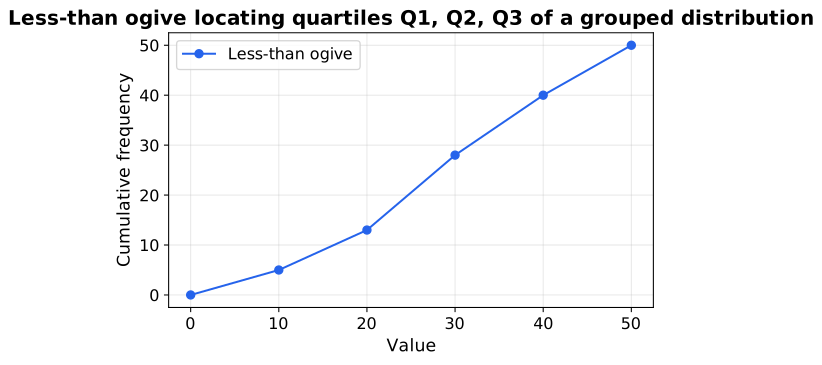
Partition values of a continuous distribution can be read straight off an ogive — the graph of the less-than cumulative frequency curve.
Drawing the less-than ogive.
- Plot the upper boundary of each class along the horizontal () axis against its less-than cumulative frequency on the vertical () axis.
- Begin the curve at the lower boundary of the first class (cumulative frequency ) and join the points with a smooth rising curve. The curve ends at the point .
Reading a partition value off the ogive.
- Mark the locating figure on the -axis — for , for , for (or , for a decile or percentile).
- Draw a horizontal line from that mark across to the ogive.
- From where it meets the curve, drop a vertical line to the -axis. The foot of that vertical is the required partition value.
Why the Ogive Works
The ogive's height at any point is the number of observations below . So the at which the height equals is exactly the value with a quarter of the data below it — the definition of . The graph therefore performs the same interpolation as the §4 formula, read visually.
Graph vs Formula …
A smooth curve plotting each class's upper boundary against its less-than cumulative frequency; its height at is the number of …
Mark (or , ) on the -axis, go horizontally to the ogive, then drop vertically to the -axis to rea …