Mathematics and Statistics · Ch 12 — Time Series
Measurement of Trend: Graphical (Freehand Curve) Method
3
Measurement of Trend: Graphical (Freehand Curve) Method
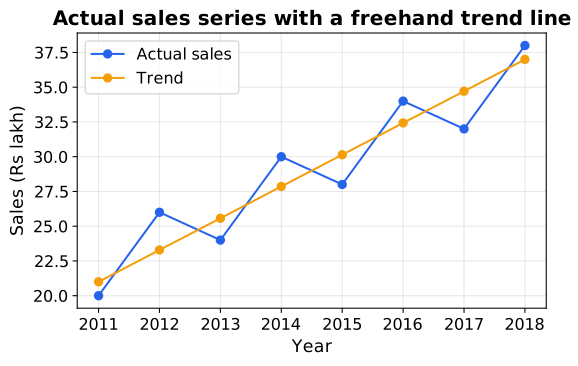
The simplest way to show the trend of a time series is to draw it. In the graphical (freehand curve) method we plot the given values against time and then draw a smooth curve or straight line, by hand and by eye, that passes through the middle of the plotted points — smoothing out the short-term seasonal, cyclical and irregular ups and downs and leaving only the long-term movement.
Steps.
- Take time (years) on the horizontal -axis and the values of the variable on the vertical -axis, choosing suitable scales.
- Plot each observation as a point and join the points to obtain the actual (historigram) curve.
- Draw a smooth freehand curve — or a straight line — through the general middle of these points, so that it lies as evenly as possible among them (roughly as many points above the line as below).
- This smooth freehand curve is the trend.
Tip
Merits and limitations …
Definition 1Freehand (graphical) method
A method of finding trend by plotting the series and drawing, by eye, a smooth curve or line through the middle of the points; quick but s …