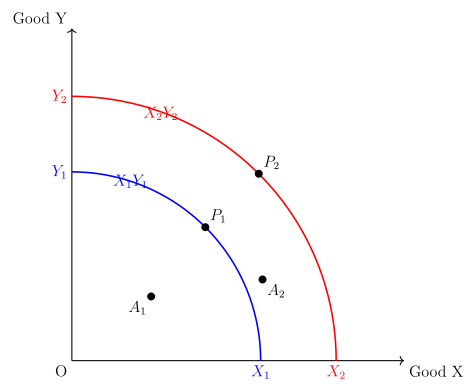
Q.In the given figure X1Y1 and X2Y2 are Production Possibility Curves in two different periods T1 and T2 respectively for Good X and Good Y. A1 and A2 represent actual outputs and P1 and P2 represent potential outputs respectively in the two time periods. The change in actual output of Goods X and Y over the two periods would be represented by movement from _________ . (Fill up the blank)
🔒You're viewing a preview — the full solution, concept, methods & PYQ mapping are locked.
🔒 Start your 14-day free trial to unlock the full solution →Part (a)Concept understanding — Production Possibility Frontier
Imagine you have only 4 hours to study after school. You can spend them all on Physics, all on Economics, or split them between the two. If you study only Physics, you might master 4 chapters. If only Economics, you could finish 6 chapters. But if you split your time, you get some of both — maybe 3 Physics chapters and 3 Economics chapters.
That trade-off is the core idea behind the Production Possibility Frontier (PPF).
What the PPF actually is
The PPF is a curve that shows all the maximum combinations of two goods (or services) an economy can produce when it uses all its resources fully and efficiently, given the current technology.
Think of a country that produces only two things: wheat and cloth. It has a fixed amount of land, labour, and machines. If it puts everything into wheat, it gets, say, 100 tonnes of wheat and zero cloth. If it puts everything into cloth, it gets 50 metres of cloth and zero wheat. In between, there are many possible combinations — 80 tonnes of wheat and 20 metres of cloth, or 50 tonnes of wheat and 35 metres of cloth, and so on.
Plot these points on a graph: wheat on the x-axis, cloth on the y-axis. The curve that connects them is the PPF.
The PPF is always drawn as a downward-sloping curve that is concave to the origin (bowed outward). The downward slope is obvious — to get more of one good, you must give up some of the other. The outward bow shape comes from the law of increasing opportunity cost, which we'll see in a moment.
The key ideas the PPF teaches
1. Scarcity and choice
The PPF is a picture of scarcity. You cannot have everything — the economy cannot produce a point outside the curve (like 100 tonnes of wheat and 50 metres of cloth) because resources are limited. Every point on the curve is efficient; every point inside the curve (like 40 tonnes of wheat and 10 metres of cloth) means resources are lying idle or being used wastefully.
2. Opportunity cost
Moving from one point on the PPF to another means producing more of one good and less of the other. The amount of the good you give up is the opportunity cost of getting more of the other good.
Here's where the shape matters. Because resources are not equally suited to producing both goods, the opportunity cost increases as you produce more of one good. Early on, you shift land that is great for wheat into cloth production — you lose only a little wheat for a lot of cloth. But as you keep shifting, you start pulling land that is excellent for wheat but terrible for cloth. Now you lose a lot of wheat for just a little extra cloth. This is the law of increasing opportunity cost, and it is why the PPF is bowed outward (concave to the origin).
Marginal Opportunity Cost (MOC) = Units of good gainedUnits of good given up
For example, if moving from combination A to B means losing 10 tonnes of wheat to gain 5 metres of cloth, the MOC of 1 metre of cloth is 510=2 tonnes of wheat.
3. Efficiency and inefficiency
- Points on the PPF: The economy is using all resources fully and efficiently. You cannot produce more of one good without producing less of the other.
- Points inside the PPF: Resources are underutilised — maybe there is unemployment, or factories are running below capacity. You can produce more of both goods without sacrificing anything.
- Points outside the PPF: Unattainable with current resources and technology.
4. Economic growth
If the economy gets more resources (more labour, more capital) or better technology, the entire PPF shifts outward. Now combinations that were previously impossible become possible. This is what we call economic growth.
Why the PPF matters (NCERT's emphasis)
The NCERT textbook uses the PPF to introduce three fundamental economic problems:
- What to produce? — Which point on the PPF should we choose?
- How to produce? — Which production method (labour-intensive or capital-intensive) keeps us on the PPF? …
Part (b)Concept understanding — Production Possibility Frontier
Imagine you have only 4 hours to study after school. You can spend them all on Physics, all on Economics, or split them between the two. If you study only Physics, you might master 4 chapters. If only Economics, you could finish 6 chapters. But if you split your time, you get some of both — maybe 3 Physics chapters and 3 Economics chapters.
That trade-off is the core idea behind the Production Possibility Frontier (PPF).
What the PPF actually is
The PPF is a curve that shows all the maximum combinations of two goods (or services) an economy can produce when it uses all its resources fully and efficiently, given the current technology.
Think of a country that produces only two things: wheat and cloth. It has a fixed amount of land, labour, and machines. If it puts everything into wheat, it gets, say, 100 tonnes of wheat and zero cloth. If it puts everything into cloth, it gets 50 metres of cloth and zero wheat. In between, there are many possible combinations — 80 tonnes of wheat and 20 metres of cloth, or 50 tonnes of wheat and 35 metres of cloth, and so on.
Plot these points on a graph: wheat on the x-axis, cloth on the y-axis. The curve that connects them is the PPF.
The PPF is always drawn as a downward-sloping curve that is concave to the origin (bowed outward). The downward slope is obvious — to get more of one good, you must give up some of the other. The outward bow shape comes from the law of increasing opportunity cost, which we'll see in a moment.
The key ideas the PPF teaches
1. Scarcity and choice
The PPF is a picture of scarcity. You cannot have everything — the economy cannot produce a point outside the curve (like 100 tonnes of wheat and 50 metres of cloth) because resources are limited. Every point on the curve is efficient; every point inside the curve (like 40 tonnes of wheat and 10 metres of cloth) means resources are lying idle or being used wastefully.
2. Opportunity cost
Moving from one point on the PPF to another means producing more of one good and less of the other. The amount of the good you give up is the opportunity cost of getting more of the other good.
Here's where the shape matters. Because resources are not equally suited to producing both goods, the opportunity cost increases as you produce more of one good. Early on, you shift land that is great for wheat into cloth production — you lose only a little wheat for a lot of cloth. But as you keep shifting, you start pulling land that is excellent for wheat but terrible for cloth. Now you lose a lot of wheat for just a little extra cloth. This is the law of increasing opportunity cost, and it is why the PPF is bowed outward (concave to the origin).
Marginal Opportunity Cost (MOC) = Units of good gainedUnits of good given up
For example, if moving from combination A to B means losing 10 tonnes of wheat to gain 5 metres of cloth, the MOC of 1 metre of cloth is 510=2 tonnes of wheat.
3. Efficiency and inefficiency
- Points on the PPF: The economy is using all resources fully and efficiently. You cannot produce more of one good without producing less of the other.
- Points inside the PPF: Resources are underutilised — maybe there is unemployment, or factories are running below capacity. You can produce more of both goods without sacrificing anything.
- Points outside the PPF: Unattainable with current resources and technology.
4. Economic growth
If the economy gets more resources (more labour, more capital) or better technology, the entire PPF shifts outward. Now combinations that were previously impossible become possible. This is what we call economic growth.
Why the PPF matters (NCERT's emphasis)
The NCERT textbook uses the PPF to introduce three fundamental economic problems:
- What to produce? — Which point on the PPF should we choose?
- How to produce? — Which production method (labour-intensive or capital-intensive) keeps us on the PPF? …
Part (a)
The Production Possibility Curve shows potential (maximum) output when resources are fully and efficiently used; actual output is what is really produced and may lie on or inside the curve. Here A1 and A2 are the actual outputs in periods T1 and T2. The change in actual output over the two periods is therefore the movement from A1 to A2 — option (d). …
Part (a): Actual output changes from A1 to A2 — option (d).
Part (b): A constant MRT gives a straight-line PPC.
Part (a)
A Production Possibility Curve (PPC) shows the maximum combinations of two goods an economy can produce with given resources and technology. Points on the curve represent potential output (full, efficient use of resources); points inside it represent actual output when resources are under-utilised or used inefficiently. …
- COHSEM Manipur Higher Secondary 1st Year (Commerce) 2026Set ANNUAL1 markMCQQ.The technique of production is related to the Central Problem of – (A) What to produce (B) How to produce (C) For whom to produce (D) What provision be made for economic growth
›Reveal solutionSolution
Choosing the technique (labour-intensive vs capital-intensive method) of production is the central problem of 'How to produce'.
Every economy faces three basic central problems because resources are scarce relative to wants: What to produce (which goods/services and in what quantities), How to produce (which technique/method — labour-intensive or capital-intensive — to use for producing the chosen goods), and For whom to produce (how the output is to be distributed among members of society). The 'technique of production' refers directly to the method of combining factors of pr …
- COHSEM Manipur Higher Secondary 1st Year (Commerce) 2025Set ANNUAL1 markMCQQ.The opportunity cost is : (A) Out of pocket cost (B) Out of pocket plus cost incurred by the Government. (C) Value of all opportunities for zone. (D) The value of the next best alternative good that is given up for it.
›Reveal solutionSolution
Opportunity cost = value of the best alternative forgone.
Because resources are scarce and have alternative uses, choosing to produce or buy one good means giving up the next best alternative that could have been produced or bought with the same resources. This forgone alternative's value is the opportunity cost — it is an implicit cost, not an explicit out-of-pocket payment. Option (A) only describes explicit/out-of-pocket cost. Option (B) wrongly ties it to Government cost. Option (C) i …
- COHSEM Manipur Higher Secondary 1st Year (Commerce) 2024Set ANNUAL1 markQ.Define Production Possibility Frontier.
›Reveal solutionSolution
The PPF is the boundary/locus of maximum output combinations obtainable from a given set of resources and technology.
The Production Possibility Frontier (also called the Production Possibility Curve) is the graph/locus of all those combinations of two goods (or two groups of goods) that an economy can produce by fully and efficiently utilising its given fixed resources and existing technology. Points on the frontier represent efficient, fully-utilised production; points inside it represent underutilisation of resources; and points outside it are c …
- COHSEM Manipur Higher Secondary 1st Year (Commerce) 2020Set ANNUAL1 markQ.Why is production possibility curve generally concave to the origin ? Give a reason.
›Reveal solutionSolution
The Production Possibility Curve (PPC) is concave to the origin because the marginal opportunity cost of producing an additional unit of one good (in terms of the other good given up) keeps rising as more of that good is produced.
Resources (factors of production) are not perfectly substitutable between different uses — some resources are better suited to producing good X and others to producing good Y. As an economy shifts resources from producing good Y to producing more of good X, it must progressively draw in resources that are less and less suited to producing X. This means each additional unit of X requires giving up increasing amounts of Y — i.e. the Marginal Rate of Transformation (MRT) increases. This increasing …
🎓Unlock everything free for 14 days
- ✓Full step-by-step solutions
- ✓Concept-first explanations
- ✓Methods, shortcuts & mistakes
- ✓PYQ mapping + timed mock tests
Full access for 14 days. No credit card required.