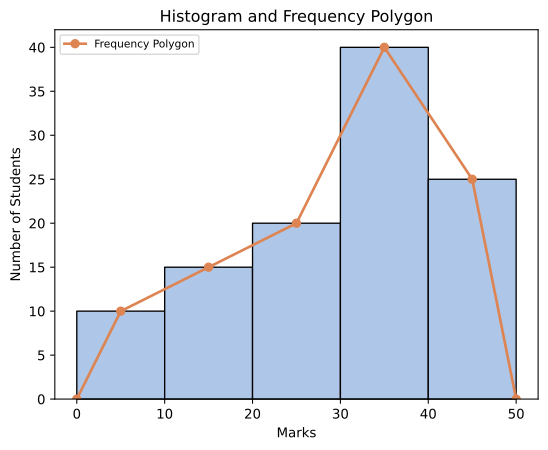
Construct histogram and frequency polygon for the following data :
| Marks | 0-10 | 10-20 | 20-30 | 30-40 | 40-50 |
|---|---|---|---|---|---|
| No. of students | 10 | 15 | 20 | 40 | 25 |
OR
Construct a pie diagram to represent the following information of expenditure of a family :
| Items of expenditure | Food | Clothing | Housing | Education | Misc. |
|---|---|---|---|---|---|
| % of total expenditure | 50 | 10 | 15 | 20 | 5 |
You're viewing a preview — the full solution, concept, methods & PYQ mapping are locked.
Start your 14-day free trial to unlock the full solution →Draw adjoining bars over each class (height = frequency) for the histogram; join the midpoints of bar-tops (extended to zero at both ends) for the frequency polygon.
Data: Marks: 0-10,10-20,20-30,30-40,40-50; No. of students: 10,15,20,40,25. All class widths are equal (= 10), so no adjustment of frequencies is needed.
Histogram: On the X-axis, mark the class boundaries (0,10,20,30,40,50); on the Y-axis, mark frequency. Draw adjoining (touching) rectangular bars over each class interval, with height equal to that class's frequency — bars of height 10, 15, 20, 40, and 25 respectively, with no gaps between them.
Frequency polygon: Mark the mid-point of the top of each histogram bar — at mid-values 5, 15, 25, 35, 45 (with heights 10, 15, 20, 40, 25) — and join these points by straight lines. To close the polygon, extend it to touch the X-axis at the midpoints of two imaginary classes of zero frequency just before the first class and just after the last class, i.e., at mid-values −5 and 55.
…
Unlock everything free for 14 days
- Full step-by-step solutions
- Concept-first explanations
- Methods, shortcuts & mistakes
- PYQ mapping + timed mock tests
Full access for 14 days. No credit card required.