Question of 63
Q.Value based question. The above figure shows the effect of light on the rate of photosynthesis. Based on the graph, answer the following questions:
(a) At which region(s) (A, B or C) in the curve is light a limiting factor? [1]
(b) What could be the limiting factor(s) in region A? [1]
(c) What do C and D represent on the curve? [2]
Meghalaya MboseMBOSE Meghalaya 11th Board 2019Subjective· 4mImportance★★★★★
0% · 0/63 Questions
You're viewing a preview — the full solution, concept, methods & PYQ mapping are locked.
Start your 14-day free trial to unlock the full solution →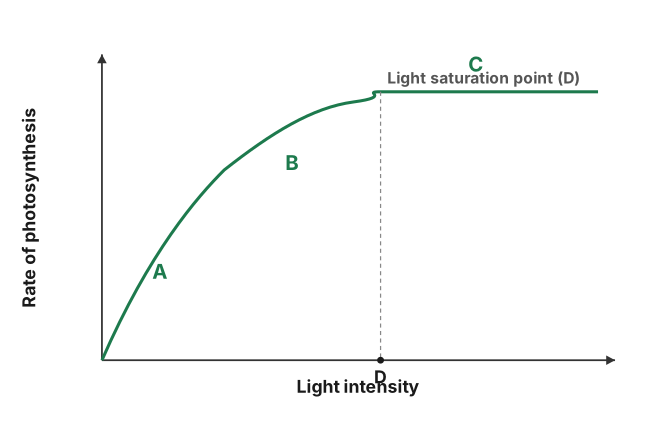
The curve shows rate of photosynthesis rising with light intensity (light-limited region A–B) until it plateaus (region C), where a factor other than light — such as CO2 or temperature — becomes limiting; D marks the light intensity at which the plateau begins.
This is a classic 'limiting factors' graph, based on Blackman's law of limiting factors, which states that when a process depends on several factors, its rate is limited by whichever factor is nearest its minimum ('the factor in shortest supply').
- Where is light a limiting factor (A, B or C)? Light is limiting wherever an increase in light intensity produces a corresponding increase in the rate of photosynthesis — that is the rising part of the curve, regions A and B. In this range, the plant simply doesn't have enough light energy to run photosynthesis any faster, so supplying more light directly raises the rate.
- What could be the limiting factor(s) in region A? Since the curve is rising steeply here (roughly proportional to light intensity), the limiting factor in region A is simply the low light intensity itself — there isn't yet enough light to drive the light reactions any faster.
- What do C and D represent on the curve? …
Unlock everything free for 14 days
- Full step-by-step solutions
- Concept-first explanations
- Methods, shortcuts & mistakes
- PYQ mapping + timed mock tests
Full access for 14 days. No credit card required.