Q.A woman pushes a trunk on a railway platform which has a rough surface. She applies a force of over a distance of . Thereafter, she gets progressively tired and her applied force reduces linearly with distance to . The total distance through which the trunk has been moved is . Plot the force applied by the woman and the frictional force, which is , versus displacement. Calculate the work done by the two forces over .
You're viewing a preview — the full solution, concept, methods & PYQ mapping are locked.
Start your 14-day free trial to unlock the full solution →The work done by the woman is the total area under her force-displacement graph — a rectangle plus a trapezoid — giving . The work done by friction is the area under the constant friction force graph, giving . The net work is .
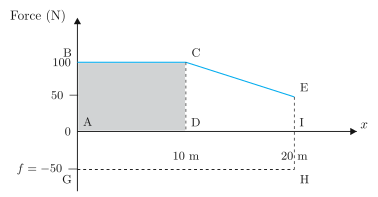
The figure is a force–displacement graph. The horizontal axis is displacement in metres; the vertical axis is force in newtons. Two curves are plotted. A solid blue line shows the force applied by the woman. From point B to point C (displacement 0 to 10 m) this force is constant at 100 N. From C to E (10 m to 20 m) it falls linearly to 50 N. A dashed line shows the opposing frictional force , which is constant at N from point G to point H (the full 0 to 20 m displacement). The negative sign means friction acts opposite to the direction of displacement. A rectangle ABCD is shaded, with A and D on the displacement axis at 0 and 10 m, and B and C at the 100 N level. Points A through I label key positions on the curves and axes.
The physical idea is central: when a force varies with position, the work done is not simply force times displacement. Instead, work equals the area under the force–displacement curve. For the applied force , the work done from to is
The figure makes this concrete. The work done by the woman from 0 to 10 m is the area of rectangle ABCD: . From 10 to 20 m, the force drops linearly, so the work is the area of the trapezoid under that sloping segment — the textbook calculates it as the average force times displacement, or directly from the graph. The total work by the applied force is the sum of these two areas.
The frictional force is constant at N over the entire 20 m. Its work is simply , which is the area of the dashed rectangle (negative because the force opposes motion). The net work done on the object is the sum: .
The key formula developed with this figure is the definition of work for a variable force:
where is the force as a function of position, and the integral equals the area under the – curve between the limits.
A common mistake is to treat the work done by a variable force as without checking that the force varies linearly. The area method — summing rectangles or trapezoids — always works, even for nonlinear forces. The figure deliberately uses a linear decrease to show that the area is a trapezoid, not a rectangle.
The shaded rectangle ABCD is a visual anchor: it isolates the constant-force segment so you see that even when the force later changes, the work for that part is still just the area of a rectangle. The dashed friction line at N reinforces that opposing forces contribute negative work, and that constant opposing forces produce a rectangular area too — but below the axis.
Why the Work-Energy Theorem is the natural lens
Work is not just a formula — it is the transfer of energy by a force acting over a distance. When a force changes with position, you cannot simply multiply force and displacement; you must find the area under the force-displacement graph. That area is the work.
Here, the woman's applied force changes in two distinct phases: constant at first, then linearly decreasing. Friction, however, is constant throughout. The problem asks for the work done by each force separately — so we treat them as independent agents, each contributing its own area.
A common mistake is to treat the applied force as if it were constant over the entire . The problem explicitly says it reduces linearly after . Always check whether a force is constant or variable before plugging into .
Step-by-step solution
1. Sketch the force-displacement graphs
We have two forces to plot:
-
Applied force by the woman:
From to , it is constant at .
From to , it drops linearly from to .
-
Frictional force:
Constant at throughout, but acting opposite to the direction of motion. On a force vs. displacement graph, we take the magnitude for area calculation, then assign the sign based on direction. …
Unlock everything free for 14 days
- Full step-by-step solutions
- Concept-first explanations
- Methods, shortcuts & mistakes
- PYQ mapping + timed mock tests
Full access for 14 days. No credit card required.