Physics · Ch 10 — Wave Optics
The Single Slit
The Single Slit
Why does light spread after passing through a single slit?
When a narrow slit is illuminated by a monochromatic (single-wavelength) light source, the light does not travel in a perfectly straight line. Instead, it bends around the edges of the slit and spreads into the region that would otherwise be a shadow. This bending is called diffraction. It can only be explained using the wave nature of light — just as sound waves bend around a corner, light waves do the same through a narrow opening.
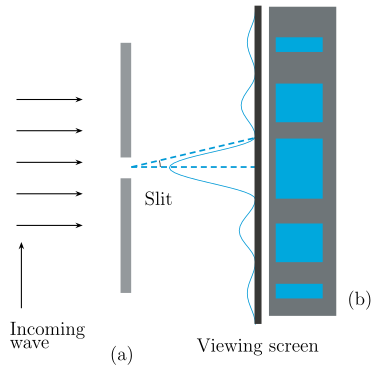
If you replace the double slit in Young’s experiment with a single narrow slit of width , the screen shows a broad central bright region (the central maximum). On either side, there are alternating dark and bright bands (secondary maxima and minima), with the intensity becoming weaker as you move away from the centre.
How to understand the pattern: the path difference idea
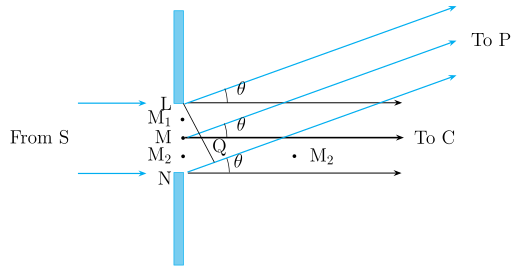
Consider a slit of width , with its midpoint labelled . A parallel beam of monochromatic light falls normally (perpendicularly) on the slit. The diffracted light travels to a screen. A straight line through , perpendicular to the slit plane, meets the screen at point (the centre).
We want the intensity at any point on the screen. The lines joining to different points along the slit (like , , ) can be treated as parallel to each other, making an angle with the normal .
Key idea: Divide the slit into many tiny parts. Each part acts as a secondary source of waves (Huygens’ principle). Because the incoming wavefront is parallel to the slit plane, all these secondary sources are in phase at the slit. The pattern on the screen arises from the superposition of waves from all these tiny parts, with different phase differences due to different path lengths to .
Where do the minima and maxima occur?
The condition for minima (zero intensity) is:
- = width of the slit
- = angle from the normal to the point on the screen
- = wavelength of light
- = order of the minimum (nonzero integer)
The condition for secondary maxima (bright fringes other than the central one) is:
- The central maximum occurs at (straight ahead). It is the brightest and broadest.
- The secondary maxima become weaker and weaker as increases (i.e., as you go further from the centre).
Key formulas (summary)
- Minima (dark fringes):
Meaning: Zero intensity occurs when the path difference between waves from the two edges of the slit equals an integer multiple of the wavelength.
- Secondary maxima (bright fringes):
Meaning: Bright fringes (other than the central one) occur when the path difference equals a half-integer multiple of the wavelength. …
Drawn by us to help you understand the concept clearly, and verified to make sure it's accurate. For exams, practice from your textbook's own diagram.
The figure shows a single slit of width , labelled LN, with its midpoint M. A parallel beam of monochromatic light (plane wavefront) falls normally on the slit from the left. The slit opening is vertical, and the light spreads out after passing through it.
The screen is placed to the right, perpendicular to the original direction of the beam. The point C on the screen is directly opposite the midpoint M — it lies on the straight line through M perpendicular to the slit plane. The point P is any other point on the screen, at an angle measured from the line MC.
Rays from different points across the slit (L, M, N) travel to P. Because P is far away, these rays are treated as parallel, all making the same angle with the normal MC. The key geometric feature is the path difference between a ray from the top edge L and a ray from the bottom edge N. This path difference is labelled as in the diagram.
Physical idea: The slit is divided into many tiny segments, each acting as a secondary source of light (Huygens’ principle). All these sources are in phase because the incident wavefront is plane and parallel to the slit. However, at an angle , the waves from different parts of the slit travel different distances to reach P, creating a phase difference. The net amplitude at P is the sum of contributions from all these sources, taking into account their relative phases.
Key formula(s) developed from this figure:
The condition for minima (zero intensity) on the screen is:
where:
- = width of the slit,
- = angle of the point P from the central line MC,
- = wavelength of the monochromatic light,
- = order of the minimum (non-zero integer). …
Drawn by us to help you understand the concept clearly, and verified to make sure it's accurate. For exams, practice from your textbook's own diagram.
The figure presents two complementary views of the single-slit diffraction pattern. The upper part is a graph plotting intensity (vertical axis) against angle (horizontal axis, measured from the central normal line ). The lower part is a schematic band strip representing the actual photograph of the fringes: a broad, bright central band flanked by much fainter side bands.
What the graph shows:
- A single, tall central maximum at . This is the brightest and widest feature.
- On either side, minima (zero intensity) occur at angles where is the wavelength of light and is the slit width.
- Between successive minima lie secondary maxima — much weaker and narrower than the central maximum. Their positions are approximately at (i.e., for ).
- The intensity of these secondary maxima falls off rapidly as increases.
What the band strip shows:
- A broad bright central region corresponding to the central maximum.
- On each side, faint narrow bands (the secondary maxima) separated by dark gaps (the minima). The bands become progressively dimmer away from the centre.
Physical idea taught by the figure:
The pattern arises because each point across the slit acts as a coherent secondary source (Huygens’ principle). Light from different parts of the slit travels different distances to a point on the screen, creating a phase difference. The resultant amplitude at is the sum of contributions from all these sources. When the path difference between the two edges of the slit equals an integer multiple of , destructive interference produces a minimum. The central maximum is brightest because all contributions arrive nearly in phase.
Key formula developed with this figure:
The intensity for a single slit of width is given by
where
- is the intensity at the centre (),
- ,
- is the wavelength of the monochromatic light,
- is the slit width. …