Economics · Ch 3 — Organisation of Data
Raw Data
Raw Data
Data as first collected are raw or unclassified — disorganised, usually bulky, and awkward to work with. Meaningful conclusions cannot be drawn from them easily because they do not lend themselves to statistical methods until they are organised.
An example is the marks in mathematics of 100 students recorded just as they came in — a block of 100 unordered numbers such as 47, 45, 10, 60, 51, … Asked for the highest mark, you would first have to sort all 100 values in ascending or descending order, a tedious task that becomes far worse with 1,000 students.
| 47 | 45 | 10 | 60 | 51 | 56 | 66 | 100 | 49 | 40 |
| 60 | 59 | 56 | 55 | 62 | 48 | 59 | 55 | 51 | 41 |
| 42 | 69 | 64 | 66 | 50 | 59 | 57 | 65 | 62 | 50 |
| 64 | 30 | 37 | 75 | 17 | 56 | 20 | 14 | 55 | 90 |
| 62 | 51 | 55 | 14 | 25 | 34 | 90 | 49 | 56 | 54 |
| 70 | 47 | 49 | 82 | 40 | 82 | 60 | 85 | 65 | 66 |
| 49 | 44 | 64 | 69 | 70 | 48 | 12 | 28 | 55 | 65 |
| 49 | 40 | 25 | 41 | 71 | 80 | 0 | 56 | 14 | 22 |
The same problem appears in the monthly food expenditure of 50 households (values like 1904, 1559, 3473, …): finding the average by eye is very hard, and the difficulty multiplies for 5,000 households.
| 1904 | 1559 | 3473 | 1735 | 2760 |
| 2041 | 1612 | 1753 | 1855 | 4439 |
| 5090 | 1085 | 1823 | 2346 | 1523 |
| 1211 | 1360 | 1110 | 2152 | 1183 |
| 1218 | 1315 | 1105 | 2628 | 2712 |
| 4248 | 1812 | 1264 | 1183 | 1171 |
| 1007 | 1180 | 1953 | 1137 | 2048 |
| 2025 | 1583 | 1324 | 2621 | 3676 |
The scale of the problem is clear from the Census of India, taken every ten years — Census 2001 contacted about 20 crore persons. Such raw counts mean nothing until they are classified by gender, education, marital status, occupation and so on, after which the structure of the population becomes readable.
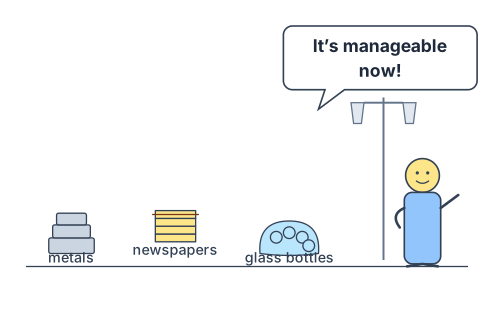
Drawn by us to help you understand the concept clearly, and verified to make sure it's accurate. For exams, practice from your NCERT textbook's own diagram.
Own-drawn recreation of the NCERT cartoon (p.24), the 'after' companion to the chaos cartoon: the same kabadiwallah, now relaxed, with his junk grouped into neat, separate piles — newspapers, glass bottles, metals — and the caption "It's manageable now!". It illustrates the benefit classification brings: once similar items are grouped, a particular item is easy to locate. Scene and caption are the book's own facts, reproduc …
…