Applied Mathematics · Ch 7 — Inferential Statistics
Concept Map
Concept Map
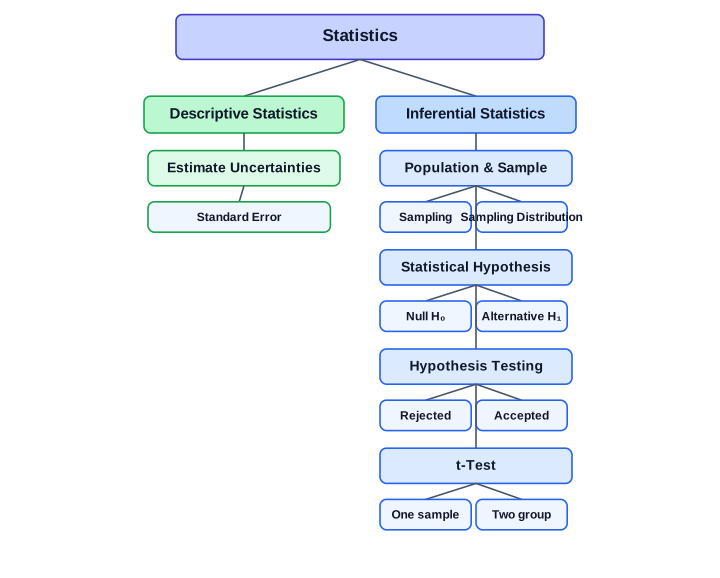
This concept map shows how the chapter fits together. Statistics splits into descriptive statistics — which summarises data and estimates the uncertainty in those summaries through the standard error — and inferential statistics, which uses a sample drawn from a population to draw conclusions about the whole. Inference works by stating a statistical hypothesis (a null H₀ and an alternative H₁), then using hypothesis testing to decide whether H₀ is rejected or accepted, most commonly with the t-test for one sample or for two independent groups.
Drawn by us to help you understand the concept clearly, and verified to make sure it's accurate. For exams, practice from your NCERT textbook's own diagram.
Concept map of the chapter.