Economics · Ch 6 — Open Economy Macroeconomics
Determination of the Exchange Rate
Determination of the Exchange Rate
Determination of the Exchange Rate
Different countries use different methods to set the value of their currency in terms of foreign currencies. The three main systems are flexible exchange rates, fixed exchange rates, and managed floating exchange rates. Each system works differently and has distinct implications for the economy.
Flexible Exchange Rate
A flexible exchange rate — also called a floating exchange rate — is determined entirely by the market forces of demand and supply. No government or central bank intervention takes place. The exchange rate settles at the point where the demand for foreign currency equals the supply of foreign currency.
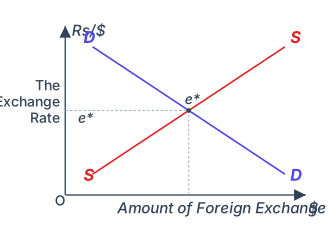
In the standard diagram, the vertical axis measures the exchange rate (rupees per dollar, for example) and the horizontal axis measures the quantity of dollars. The demand curve for dollars slopes downward: when the dollar becomes cheaper (fewer rupees per dollar), Indians demand more dollars because foreign goods become cheaper. The supply curve of dollars slopes upward: when the dollar becomes more expensive (more rupees per dollar), Americans supply more dollars because Indian goods become cheaper for them. The intersection of these two curves gives the equilibrium exchange rate, marked as point on the vertical axis, and the equilibrium quantity of dollars, marked as point on the horizontal axis.
In a completely flexible system, the central bank does not buy or sell foreign currency. The exchange rate moves freely in response to changes in demand and supply.
Drawn by us to help you understand the concept clearly, and verified to make sure it's accurate. For exams, practice from your NCERT textbook's own diagram.
The figure is a standard supply-and-demand diagram for the foreign exchange market. The vertical axis is labelled Rs/ — the quantity of US dollars traded.
Two curves are drawn. The demand curve for foreign exchange (D) slopes downward from left to right. It represents the demand for dollars by Indians who need to pay for imports, foreign travel, or investments abroad. The supply curve of foreign exchange (S) slopes upward from left to right. It represents the supply of dollars coming into India from exports, foreign investment, or remittances.
The two curves intersect at a single point. From this intersection a dashed projection line is drawn to the vertical axis, where it marks the equilibrium exchange rate, labelled e*. A second dashed line drops to the horizontal axis at the equilibrium quantity of foreign exchange traded; the book's own prose refers to this as point q, but neither the printed figure nor this SVG prints a "q" tick on the axis — the horizontal axis simply carries the title Amount of Foreign Exchange (in US dollars), and the equilibrium quantity is the (unlabelled) point directly below the intersection. …
Effect of an Increase in Demand for Imports
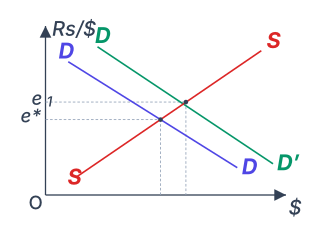
Suppose Indians increase their demand for foreign goods and services — for example, because more Indians travel abroad. This increases the demand for dollars. The demand curve shifts upward and to the right. The original equilibrium exchange rate is , meaning that Rs 50 must be exchanged for one dollar. After the shift, the new equilibrium exchange rate becomes , meaning that Rs 70 must now be paid for one dollar.
This increase in the exchange rate — from Rs 50 per dollar to Rs 70 per dollar — means that the price of foreign currency (dollar) in terms of domestic currency (rupee) has risen. The rupee has become cheaper relative to the dollar. This is called depreciation of the domestic currency.
Drawn by us to help you understand the concept clearly, and verified to make sure it's accurate. For exams, practice from your NCERT textbook's own diagram.
Figure 6.2 is a standard demand-and-supply diagram of the foreign exchange market. The vertical axis is labelled Rs/ — the quantity of US dollars traded per period.
There is one upward-sloping supply curve, labelled S. It represents the supply of US dollars to the Indian market (coming from Indian exports, foreign investment inflows, etc.). There are two downward-sloping demand curves. The original one is labelled D; the new one is labelled D' and lies to the right of D — meaning at every exchange rate, a larger quantity of dollars is demanded. The shift from D to D' is described in the textbook as an increase in demand for imports (e.g., more Indians travelling abroad or buying foreign goods).
The original equilibrium is where D and S intersect. From that intersection, a dashed horizontal line is drawn to the vertical axis, marking the initial exchange rate e* (the textbook gives the example e* = Rs 50 per dollar). A dashed vertical line from the same intersection meets the horizontal axis, marking the initial quantity of dollars traded.
The new demand curve D' intersects the supply curve S at a higher point. From this new intersection, another dashed horizontal line goes to the vertical axis, marking the new exchange rate e₁ (the textbook example gives e₁ = Rs 70 per dollar). A dashed vertical line from this intersection meets the horizontal axis, showing the new, larger quantity of dollars traded.
The key teaching point: an increase in the demand for imports shifts the demand curve for foreign exchange to the right. Under a flexible exchange rate, this raises the exchange rate (more rupees per dollar), which means the domestic currency (rupee) has depreciated — it now buys fewer dollars than before. …
Conversely, if the price of domestic currency in terms of foreign currency rises — meaning fewer rupees are needed to buy one dollar — that is called appreciation of the domestic currency.
Do not confuse depreciation with devaluation. Depreciation occurs in a flexible exchange rate system due to market forces. Devaluation occurs in a fixed exchange rate system due to government action. The two terms are not interchangeable.
Speculation
Money is an asset. If people believe that a foreign currency will increase in value relative to the domestic currency, they will want to hold that foreign currency. This expectation itself can affect the exchange rate in the present.
Consider an example. The current exchange rate is Rs 80 per British pound. Investors believe that the pound will appreciate by the end of the month to Rs 85 per pound. An investor who gives the dealer Rs 80,000 and buys 1,000 pounds expects to exchange those pounds for Rs 85,000 at the end of the month, making a profit of Rs 5,000. This expectation increases the demand for pounds today, which pushes the rupee-pound exchange rate upward in the present. The belief becomes self-fulfilling.
Speculation can cause exchange rates to move even when no change in actual trade or investment flows has occurred. The mere expectation of a future change can bring about that change immediately.
Interest Rates and the Exchange Rate
In the short run, a major factor influencing exchange rate movements is the interest rate differential — the difference between interest rates in different countries. Huge funds owned by banks, multinational corporations, and wealthy individuals move around the world seeking the highest interest rates.
Suppose government bonds in country A pay 8 per cent interest, while equally safe bonds in country B pay 10 per cent. The interest rate differential is 2 per cent. Investors from country A will be attracted by the higher interest rate in country B. They will sell their own currency (country A's currency) and buy the currency of country B. At the same time, investors in country B will find investing in their own country more attractive and will therefore demand less of country A's currency.
The result: the demand curve for country A's currency shifts to the left, and the supply curve of country A's currency shifts to the right. This causes a depreciation of country A's currency and an appreciation of country B's currency.
A rise in interest rates at home often leads to an appreciation of the domestic currency. This assumes that no restrictions exist on buying bonds issued by foreign governments.
Income and the Exchange Rate
When income increases, consumer spending increases. Spending on imported goods is also likely to increase. When imports increase, the demand curve for foreign exchange shifts to the right, causing a depreciation of the domestic currency.
If income abroad also increases, domestic exports will rise. This shifts the supply curve of foreign exchange outward. On balance, the domestic currency may or may not depreciate — it depends on whether exports are growing faster than imports.
Other things remaining equal, a country whose aggregate demand grows faster than the rest of the world's normally finds its currency depreciating. Its imports grow faster than its exports, so its demand curve for foreign currency shifts faster than its supply curve.
Exchange Rates in the Long Run: Purchasing Power Parity
The purchasing power parity (PPP) theory is used to make long-run predictions about exchange rates in a flexible exchange rate system. According to this theory, as long as there are no barriers to trade — such as tariffs (taxes on trade) or quotas (quantitative limits on imports) — exchange rates should eventually adjust so that the same product costs the same whether measured in rupees in India, dollars in the US, yen in Japan, and so on, except for differences in transportation costs.
Over the long run, exchange rates between any two national currencies adjust to reflect differences in the price levels in the two countries.
Example 6.1 · A Shirt and Purchasing Power Parity
Suppose a shirt costs 8 dollars in the United States and Rs 400 in India. With no barriers to trade, the two prices must line up, so the rupee–dollar exchange rate should be per dollar.
Why must it settle there? At any higher rate — say Rs 60 per dollar — the American shirt would cost Rs 480 () while the identical Indian shirt costs only Rs 400, so every customer would buy from India. At any rate below Rs 50 per dollar the shirt business would shift entirely to the United States. Only at Rs 50 per dollar do the two prices agree.
Now suppose prices rise by 20 per cent in India while prices in the US rise by 50 per cent. The Indian shirt now costs , and the American shirt costs dollars. For the two to be equivalent, 12 dollars must be worth Rs 480 — that is, one dollar must now be worth Rs 40. The rate has moved from Rs 50 to Rs 40 per dollar, so the dollar has depreciated (and the rupee has appreciated). This is exactly what purchasing power parity predicts: because US prices rose faster than Indian prices, the dollar loses value against the rupee over the long run.
Fixed Exchange Rate
In a fixed exchange rate system, the government fixes the exchange rate at a particular level. The central bank intervenes in the foreign exchange market to maintain that rate. …
Drawn by us to help you understand the concept clearly, and verified to make sure it's accurate. For exams, practice from your NCERT textbook's own diagram.
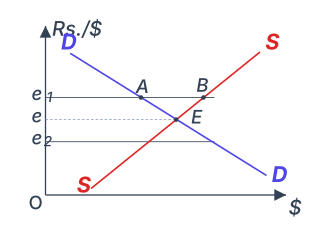
The figure plots the foreign exchange market with the exchange rate (domestic currency per unit of foreign currency, say rupees per dollar) on the vertical axis and the quantity of foreign exchange (dollars) on the horizontal axis. A downward-sloping demand curve D and an upward-sloping supply curve S intersect at point E, which marks the market-clearing equilibrium rate e. At this rate, the quantity of dollars demanded equals the quantity supplied, and the balance of payments is in equilibrium without any official intervention.
The key teaching of the figure is what happens when the government fixes the exchange rate at a level different from e. A horizontal line at e₁ (above e) represents the government-fixed rate. At this higher rate, the quantity of dollars demanded (read off curve D at point A) is less than the quantity supplied (read off curve S at point B). The segment AB between the two curves shows the excess supply of dollars. Under a fixed exchange rate, the central bank (RBI) must absorb this surplus by buying the excess dollars from the market, adding to its foreign exchange reserves. This is the intervention described in the textbook: when there is a BoP surplus at the fixed rate, the government uses its reserves to mop up the gap.
Conversely, a horizontal line at e₂ (below e) shows a fixed rate lower than equilibrium. Here, the quantity demanded exceeds the quantity supplied, creating an excess demand for dollars. The RBI would have to sell dollars from its reserves to meet this shortage, depleting reserves. The textbook warns that if the public doubts the adequacy of these reserves, speculative attacks can force a devaluation. …