Economics · Ch 8 — Theory of Consumer Behaviour
Changes in the Budget Set
Changes in the Budget Set
Changes in the Budget Set
The budget set is not fixed. It depends on three things: the price of good 1, the price of good 2, and the consumer's income. Whenever any of these changes, the set of affordable bundles changes too. The textbook examines two kinds of changes separately: a change in income (with prices constant) and a change in the price of one good (with income and the other price constant).
Change in Income
Suppose the consumer's income changes from to , while the prices and stay the same. The new budget line is
which can be rearranged as
Compare this with the original budget line . The slope is still — it has not changed. Only the intercepts have changed.
- Vertical intercept (maximum mangoes): instead of .
- Horizontal intercept (maximum bananas): instead of .
If income rises (), both intercepts increase. The budget line shifts outward in a parallel fashion. The consumer can now afford more of both goods at the same market prices.
If income falls (), both intercepts decrease. The budget line shifts inward in a parallel fashion. The consumer can now afford less of both goods.
A change in income, with prices unchanged, causes a parallel shift of the budget line. The slope stays the same; only the intercepts change.
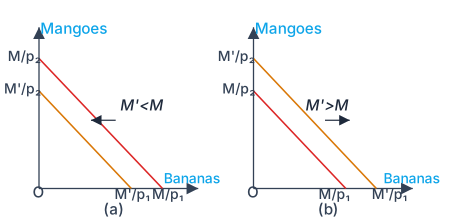
The textbook shows this in Figure 2.10 (described in words). Panel (a) shows the inward shift when income decreases: the new budget line lies entirely inside the old one. Panel (b) shows the outward shift when income increases: the new budget line lies entirely outside the old one. In both cases, the lines are parallel to the original.
Drawn by us to help you understand the concept clearly, and verified to make sure it's accurate. For exams, practice from your NCERT textbook's own diagram.
Figure 2.10 is a two-panel diagram, both panels plotting mangoes on the vertical axis and bananas on the horizontal axis. Each panel shows a single budget line, drawn as a straight downward-sloping line from the vertical intercept to the horizontal intercept.
Panel (a) shows what happens when the consumer's income falls. The original budget line (not labelled in the description, but implied by the intercepts) shifts parallel inward — meaning the new budget line is closer to the origin, with both intercepts smaller. The vertical intercept moves from to , and the horizontal intercept moves from to , where . An arrow points leftward along the budget line, indicating the direction of the shift. The slope of the line does not change because prices are unchanged; only the intercepts shrink.
Panel (b) shows the opposite case: income rises (). The budget line shifts parallel outward, away from the origin. Both intercepts increase: vertical intercept becomes , horizontal intercept becomes . An arrow points rightward, showing the outward movement. Again, the slope remains identical to the original line. …
Change in the Price of One Good
Now suppose the price of bananas changes from to , while the price of mangoes and the consumer's income remain unchanged. The new budget line is
which can be written as
Compare this with the original: .
- Vertical intercept (maximum mangoes): still — unchanged, because the price of mangoes and income have not changed.
- Slope: now instead of — the slope has changed.
- Horizontal intercept (maximum bananas): now instead of — changed.
If the price of bananas increases ():
- The absolute value of the slope becomes larger.
- The budget line becomes steeper.
- It pivots inward around the vertical intercept: the horizontal intercept decreases (the consumer can afford fewer bananas at the higher price).
If the price of bananas decreases ():
- The absolute value of the slope becomes smaller.
- The budget line becomes flatter.
- It pivots outward around the vertical intercept: the horizontal intercept increases (the consumer can afford more bananas at the lower price).
A common mistake is to think the budget line shifts parallel when only one price changes. It does not — it pivots around the intercept of the good whose price has not changed. …
Drawn by us to help you understand the concept clearly, and verified to make sure it's accurate. For exams, practice from your NCERT textbook's own diagram.
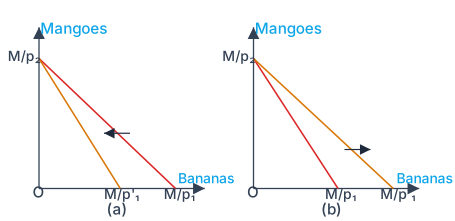
Figure 2.11 has two panels, (a) and (b), each showing a standard budget line diagram. The vertical axis is labelled "Mangoes" and the horizontal axis is labelled "Bananas". The consumer's income and the price of mangoes are fixed in both panels, so the vertical intercept — the maximum mangoes the consumer can buy — stays the same at in both cases.
Panel (a) shows what happens when the price of bananas rises. The original budget line has a horizontal intercept at (the old quantity of bananas). After the price increase to , the new budget line pivots inward around the fixed vertical intercept. The new horizontal intercept is at , which is closer to the origin than the old one. An arrow points leftward from the old intercept to the new one, indicating the decrease in the maximum bananas the consumer can afford. Because the slope of the budget line is (in absolute value, the price ratio), a higher makes the absolute slope larger, so the line becomes steeper.
Panel (b) shows the opposite case: the price of bananas falls to . The budget line pivots outward around the same vertical intercept. The new horizontal intercept lies farther to the right than the original , and an arrow points rightward to mark this increase. The absolute slope is now smaller, so the budget line becomes flatter.
In both panels, the vertical intercept never moves because the price of mangoes and income are unchanged. Only the horizontal intercept and the slope change — this is a pivot, not a parallel shift. …