Business Mathematics and Statistics · Ch 9 — Applied Statistics (Time Series, Index Numbers, Statistical Quality Control)
Measuring Trend: Method of Moving Averages
Measuring Trend: Method of Moving Averages
The method of moving averages measures trend by smoothing out the short-term ups and downs in a series, so that the underlying long-term direction becomes visible. For an odd period (3-yearly, 5-yearly, 7-yearly, ...), a -yearly moving average is computed as follows:
- Add up the values of the first years — this is the first moving total.
- Divide that total by to get the first moving average, and place it against the middle year of that block of years.
- Slide the block forward by one year — drop the earliest year's value and add the next year's value — to get the next moving total, and repeat.
Worked Example — 3-yearly moving average. A firm's sales (₹ lakh) over seven years were:
| Year | 2015 | 2016 | 2017 | 2018 | 2019 | 2020 | 2021 |
|---|---|---|---|---|---|---|---|
| Sales (₹ lakh) | 12 | 15 | 21 | 24 | 27 | 33 | 36 |
3-yearly moving totals and moving averages:
| Year | Sales | 3-yearly moving total | 3-yearly moving average (trend value) |
|---|---|---|---|
| 2015 | 12 | — | — |
| 2016 | 15 | ||
| 2017 | 21 | ||
| 2018 | 24 | ||
| 2019 | 27 | ||
| 2020 | 33 | ||
| 2021 | 36 | — | — |
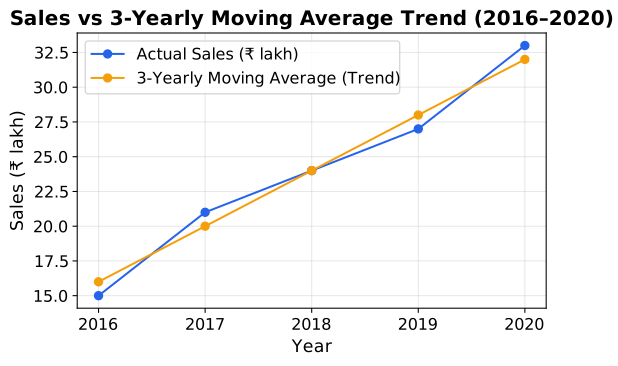
Notice two structural features of the method: the trend values (16, 20, 24, 28, 32) rise smoothly and evenly even though the raw sales figures did not, and the first and last years always lose a trend value (here, 2015 and 2021) because a full block of years cannot be centred on them — a genuine, honest limitation of the method, not a computational slip.
A method of measuring trend that replaces each value in a time series with the average of itself and a fixed number of neighbouring values, smoothing o …
The sum of consecutive values of a time series, used as the numerator when computing a -year …