Mathematics · Ch 4 — Inverse Trigonometric Functions
Graph of the Inverse Tangent Function
Graph of the Inverse Tangent Function
has domain the entire real line and range . Since is undefined (has vertical asymptotes) at , the graph of lies STRICTLY between the two horizontal lines and , approaching but never touching them — these are its two horizontal asymptotes.
Fig. 4.17 shows on , and Fig. 4.18 its reflection in : on — a flattening S-shaped curve through the origin, rising slowly as grows large and hugging its two horizontal asymptotes.
Notes.
(i) is strictly increasing and continuous on all of . …
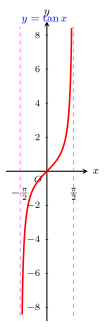
Drawn by us to help you understand the concept clearly, and verified to make sure it's accurate. For exams, practice from your textbook's own diagram.
What this figure shows. The same single branch of tangent on shown alongside its inverse to illustrate the reflection. …
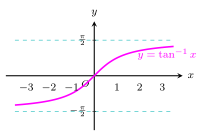
Drawn by us to help you understand the concept clearly, and verified to make sure it's accurate. For exams, practice from your textbook's own diagram.
What this figure shows. A flattening S-curve through the origin that rises from just above to just below , hugging two dashed horizontal asymptote lines and without ever touching them. …