Mathematics · Ch 11 — Probability Distributions
Distribution function (Cumulative distribution function)
Distribution function (Cumulative distribution function)
Definition 11.7 (Cumulative distribution function, continuous case). For a continuous random variable with pdf , the distribution function is
Remarks (comparing the two cases).
(1) In the discrete case directly; in the continuous case is not the probability that — indeed for every , by Definition 11.5.
(2) Passing from discrete to continuous simply replaces every sum by the corresponding integral.
(3) Because a single point carries no probability, the four inequality versions of an interval event all coincide for a continuous : — the endpoints can be included or excluded freely. …
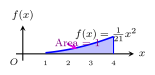
Drawn by us to help you understand the concept clearly, and verified to make sure it's accurate. For exams, practice from your textbook's own diagram.
What this figure shows. Probability density function f(x) = (1/21)x^2 on the interval 1 < x < 4, with the entire region under the curve shaded to show the total a …
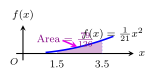
Drawn by us to help you understand the concept clearly, and verified to make sure it's accurate. For exams, practice from your textbook's own diagram.
What this figure shows. Probability density function f(x) = (1/21)x^2 with the area under the curve between x = 1.5 and x = 3.5 shaded, giving P(1.5 < X < 3. …
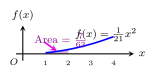
Drawn by us to help you understand the concept clearly, and verified to make sure it's accurate. For exams, practice from your textbook's own diagram.
What this figure shows. Probability density function f(x) = (1/21)x^2 with the area under the curve between x = 1 and x = 2 shaded, giving P(X <= …
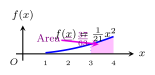
Drawn by us to help you understand the concept clearly, and verified to make sure it's accurate. For exams, practice from your textbook's own diagram.
What this figure shows. Probability density function f(x) = (1/21)x^2 with the area under the curve between x = 3 and x = 4 shaded, giving P(3 < X …