Economics · Ch 3 — Organisation of Data
Classification of Data
Classification of Data
Raw data can be grouped in several ways, and the choice depends on the purpose — just as books could be classified subject-wise, author-wise (alphabetically) or by year of publication. The main bases of classification are:
Chronological (temporal) classification — data grouped by time (years, quarters, months, weeks) in ascending or descending order. A series of values recorded over different periods is a time series. For instance, India's population by census year:
| Year | Population (crores) |
|---|---|
| 1951 | 35.7 |
| 1961 | 43.8 |
| 1971 | 54.6 |
| 1981 | 68.4 |
| 1991 | 81.8 |
| 2001 | 102.7 |
| 2011 | 121.0 |
Drawn by us to help you understand the concept clearly, and verified to make sure it's accurate. For exams, practice from your textbook's own diagram.
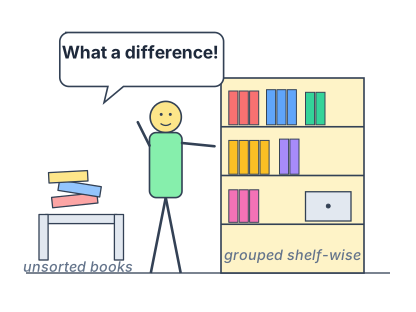
Own-drawn recreation of the NCERT cartoon (p.26): a person remarks "What a difference!" on seeing a bookshelf where books are grouped shelf-wise by subject, in contrast to a small untidy pile of loose books on a nearby desk. It sits right before Example 2 in the book, illustrating the same point the chapter opens with (classifying schoolbooks subject-wise) one more time, right where spatial/qualitative classification is being introduced. Scene and caption are the book's own facts …
Spatial (geographical) classification — data grouped by place: countries, states, cities, districts. Example, wheat yield (kg/hectare, 2013): Canada 3594, China 5055, France 7254, Germany 7998, India 3154, Pakistan 2787.
Activities
- In the population data above (Example 1), India's population was at its minimum in 1951 (35.7 crore) and at its maximum in 2011 (121.0 crore).
- In the wheat-yield data above (Example 2), the country whose yield is slightly more than India's (3154 kg/hectare) is Canada (3594 kg/hectare) — a difference of kg/hectare, or more than India's yield.
- Ascending order of yield: Pakistan (2787) < India (3154) < Canada (3594) < China (5055) < France (7254) < Germany (7998). Descending order is simply the reverse of this list.
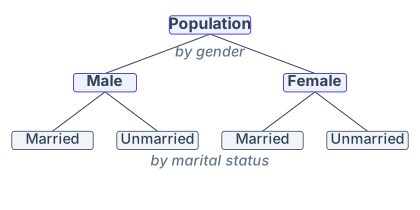
Qualitative classification — some characteristics, called qualities or attributes (nationality, literacy, religion, gender, marital status), cannot be measured numerically. They are classified by the presence or absence of the attribute. For example a population is first split by gender (male / female), and each of those can be further split by marital status (married / unmarried) — a two-stage classification on attributes.
Drawn by us to help you understand the concept clearly, and verified to make sure it's accurate. For exams, practice from your textbook's own diagram.
The figure in the NCERT Class 11 Economics chapter Organisation of Data (captioned "Example 3", p.26) is a two-level classification tree (organogram), not a bar diagram. It illustrates a two-stage qualitative (attribute) classification.
At the top sits a single box, Population. At the first stage this population is split on the presence/absence of one attribute — gender — into two boxes, Male and Female. At the second stage each of those two boxes is split again, this time on the attribute marital status, into Married and Unmarried — giving four leaf boxes in all: Male-Married, Male-Unmarried, Female-Married, Female-Unmarried.
The physical idea the figure teaches is that a qualitative classification proceeds by repeatedly splitting a group on the presence or absence of an attribute — gender first, then marital status — rather than by measuring a number, the way the quantitative classification (marks, income, height) does elsewhere in the chapter. Each level of the tree represents one more attribute being applied to refine the grouping. …
Quantitative classification — characteristics that can be measured numerically (height, weight, age, income, marks). Grouping such data into classes gives a quantitative classification. For example the 100 mathematics marks grouped into ten classes: …